
A marketing dashboard can tell you how much a business spent on ads, how many clicks it received, and how many people submitted a form. It does not automatically tell you how much it cost to acquire a new paying customer. Some orders may come from existing customers. Some leads may never buy. A campaign can generate attention while the business loses margin on every first purchase. That is why customer acquisition cost (CAC) is a more decision-oriented measure than ad spend or traffic on its own.
CAC answers a narrow but important question: How much acquisition-related spending did the business incur for each new customer acquired during a defined period? The answer is only useful when the business defines the cost scope, identifies unique new customers correctly, and aligns the measurement periods.
The customer acquisition cost formula
The book Safe Growth Engineering defines the baseline calculation as:
CAC = Total Marketing Spend ÷ New Customers
The numerator and denominator must refer to the same period. If a business spends 3,000 Egyptian pounds in a month and acquires 60 new customers during that same month, the result is EGP 50 per new customer.
That arithmetic does not, by itself, prove that the campaign is profitable. CAC is an acquisition cost metric. To make a commercial decision, compare it with first-order gross profit, repeat purchasing, customer retention, and profit-based lifetime value. Low CAC can still be poor value when customers rarely return or require costly service.
What counts as a new customer?
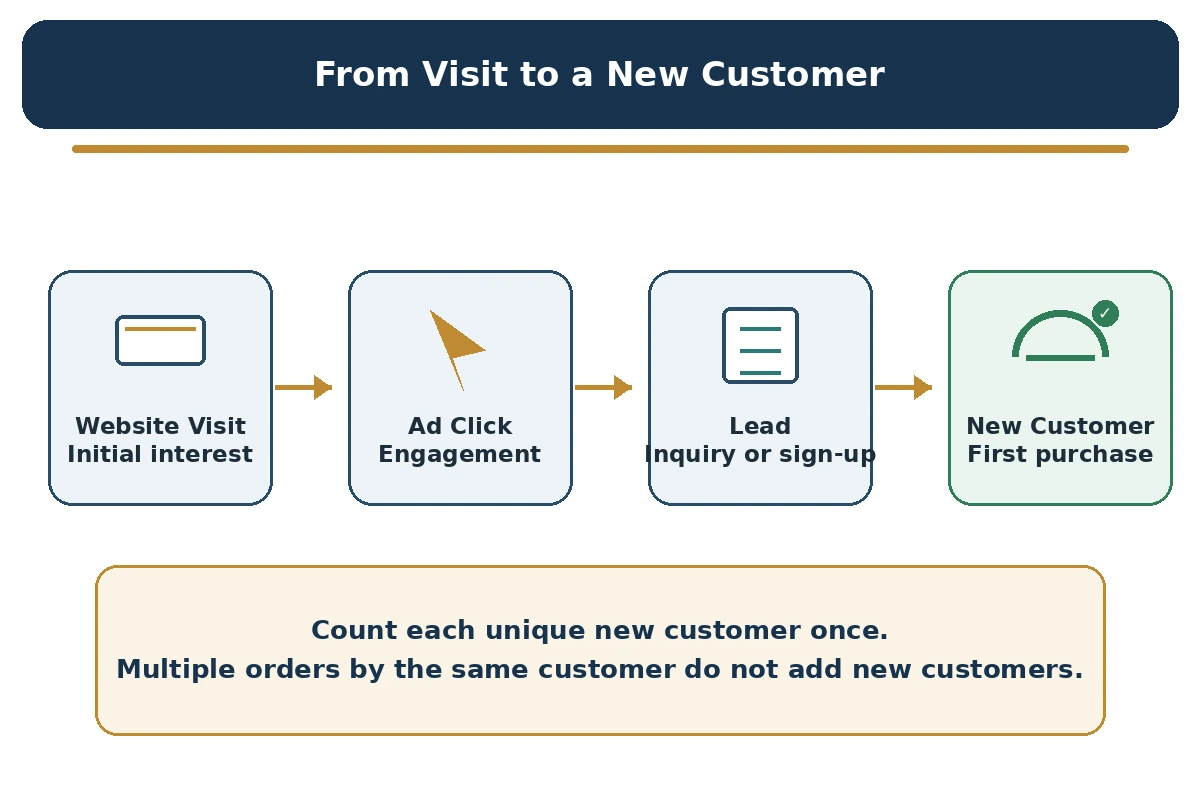
The denominator should represent unique customers who crossed the business’s agreed acquisition event during the period: a first paid purchase for a store, a first paid contract for a services firm, or a first paid subscription for a subscription business. A lead, visit, click, inquiry, demo request, or form submission is an earlier action, not a customer acquisition.
Count customers, not transactions. One customer placing three orders is still one new customer. Use a stable CRM or order-system identifier, remove duplicates, and apply the same definition across periods. If first-time customers cannot be distinguished from returning customers, mark the result incomplete rather than presenting false precision.
Which expenses should be included?
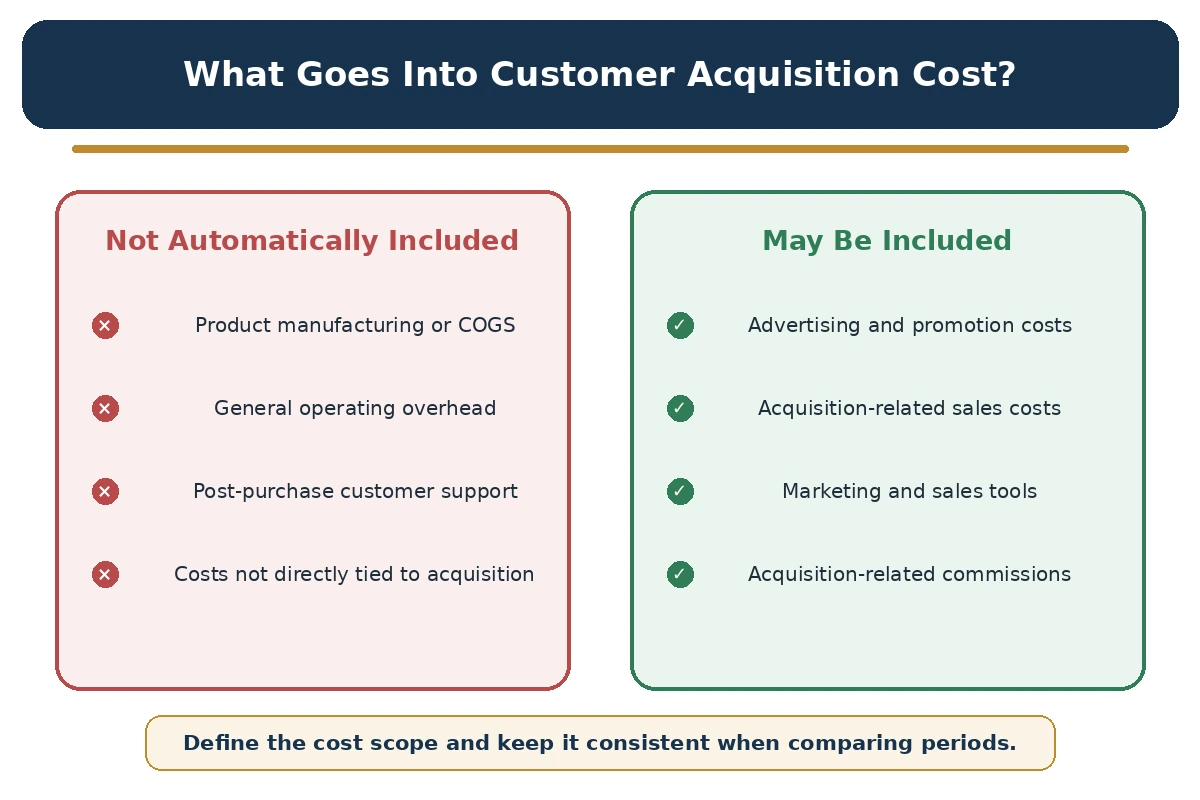
The book’s baseline formula refers to total marketing spend. For management reporting, a business may choose a broader acquisition-cost scope that includes sales expenses directly associated with winning new customers. This is a measurement policy decision: the report must say what it includes. Do not silently change the definition between months or compare figures that use different cost boundaries.
Depending on the business model and the policy selected, acquisition-related costs may include:
- Paid search, paid social, display, marketplace advertising, and other media costs.
- Creative development, campaign photography and video, landing-page copy, and content produced to attract new customers.
- Agency retainers, campaign-management fees, affiliate fees, and contractors working on customer acquisition.
- The allocated portion of marketing or sales staff compensation that relates to acquisition activity.
- Sales commissions triggered by new customer acquisition.
- CRM, email automation, analytics, lead-capture, and other tools used to attract or convert new customers.
- Introductory discounts or promotions used specifically to acquire first-time customers, when the reporting policy includes them and they are not counted twice elsewhere.
Not every expense belongs in CAC. Post-purchase support, fulfilment, ongoing account service, loyalty programmes, and win-back activity are generally retention or service costs. General infrastructure and R&D are not automatically acquisition expenses. Allocate mixed costs only on a reasonable, documented basis.
Prevent double counting: do not add creative production again if it is already included in an agency invoice. Record the period, currency, expense categories, source data, and allocation assumptions.
Stripe and Shopify both discuss advertising, team compensation, tools, and agency costs as possible acquisition expenses while distinguishing acquisition from retention. See Stripe’s CAC guide and Shopify’s CAC calculation guide.
A worked EGP example from the book
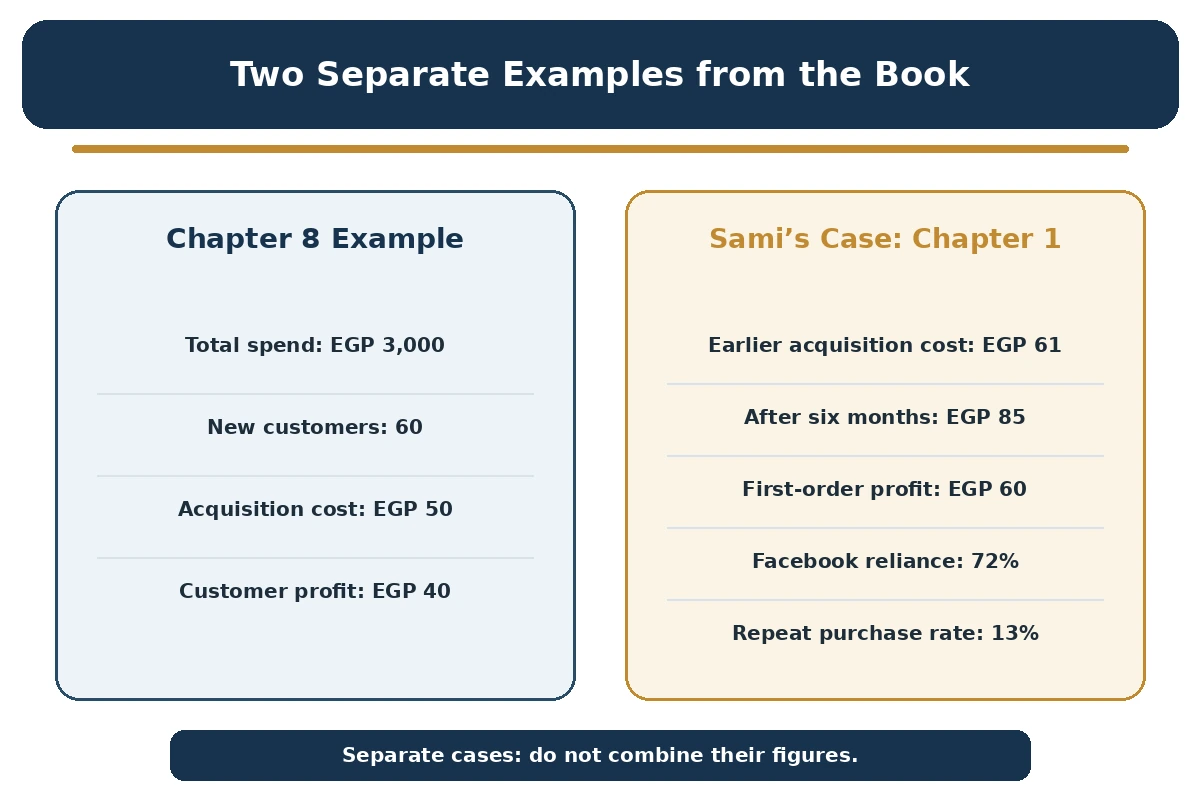
Chapter 8 of Safe Growth Engineering gives an educational example: Sami spends EGP 3,000 on advertising in one month and acquires 60 new customers in that month.
CAC = EGP 3,000 ÷ 60 = EGP 50 per new customer
The same example notes an average profit of EGP 40 per customer, meaning acquisition cost exceeds that first-customer profit by EGP 10 in the example. This is a signal to investigate the economics of the first order and the likelihood of repeat purchases. It is not a universal conclusion about all future customer value.
The example is taken from the author’s book for teaching purposes. It is not an Egyptian market average, an industry benchmark, or a verified campaign result. It is also separate from the case study about Sami in Chapter 1; do not combine the EGP 50 figure with the Chapter 1 case numbers.
The separate Chapter 1 case: why CAC needs context
Chapter 1 describes Sami’s online kitchen-supplies store and uses CAC as one part of a broader growth diagnosis. The book states that repeat customers represented 13%, 72% of sales depended on Facebook ads, and CAC rose from EGP 61 to EGP 85 over six months. Average order value was EGP 200 and gross margin was 30%, producing EGP 60 gross profit on the first order.
In that case, CAC of EGP 85 was higher than the EGP 60 first-order gross profit. This does not establish that every customer is unprofitable over the full relationship: a customer who returns may generate additional gross profit. It does mean the business needs to understand payback, repeat purchase behaviour, retention, and the time required to recover acquisition cost.
The 72% Facebook concentration exposed channel dependency. Rather than simply stopping ads or raising the budget, Sami builds an email channel and improves the post-purchase experience to encourage repeat purchases and referrals.
Blended CAC and channel CAC
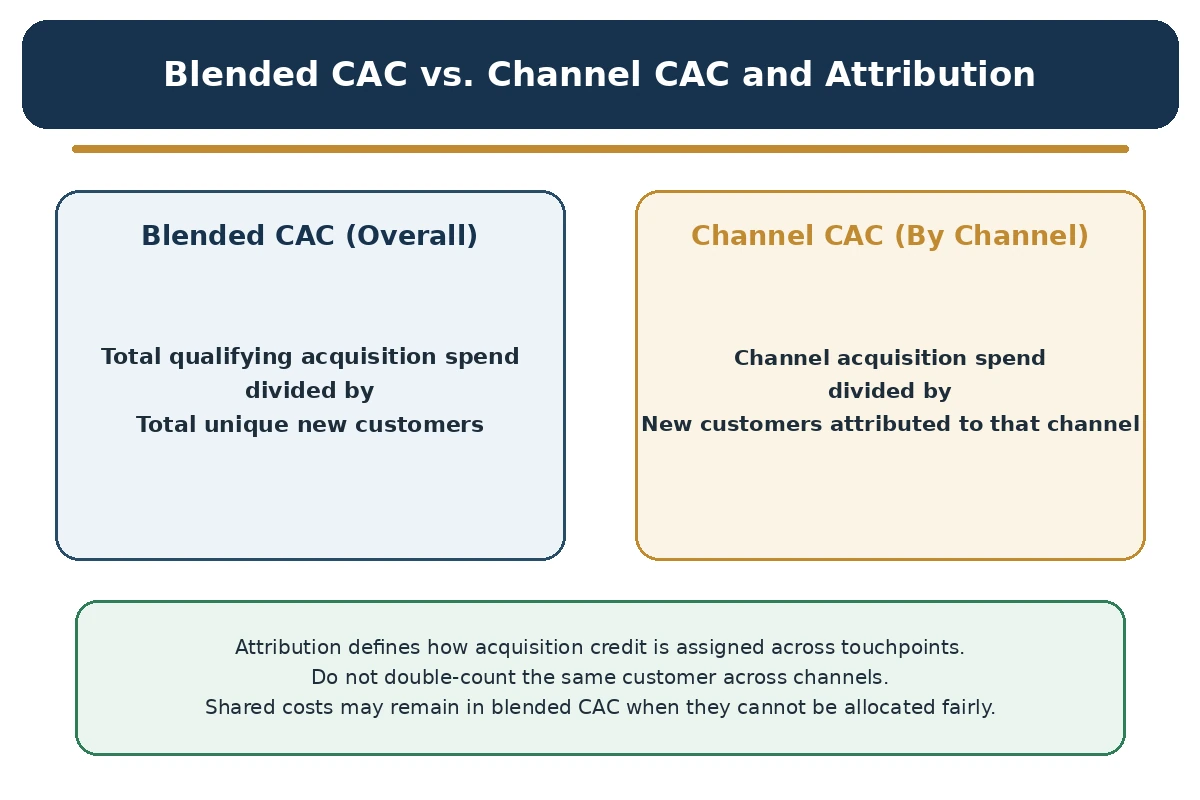
Blended CAC measures the average acquisition cost across the business. It divides total qualifying acquisition spend by all unique new customers acquired during the same period. It provides a top-level view of acquisition efficiency, but it can hide differences between channels.
Channel CAC measures acquisition cost for a specific channel:
Channel CAC = Channel Acquisition Spend ÷ New Customers Attributed to That Channel
Channel spend alone is not enough. You also need the number of unique new customers assigned to that channel using a stated attribution rule. For example, if a channel spent EGP 1,800 and was assigned 30 unique new customers under the chosen rule, its channel CAC would be EGP 60. Unless the values come from actual records, label such numbers as illustrative.
The sum of channel-attributed customers may be lower than total new customers if some records have no known source. It must not exceed the total unique customer count in a single-primary-channel report. Shared or unallocated acquisition costs can be included in blended CAC when the policy says so, but they should not be assigned to individual channels without a documented allocation method.
Do not add channel CAC values together and expect the result to equal blended CAC. CAC is a per-customer ratio, not a spend component. To reconcile the report, compare the total spend and total unique-customer counts, not the sum of channel ratios.
Attribution: how does a customer get assigned to a channel?
Attribution is the rule used to assign credit for an acquisition or conversion to a marketing touchpoint or channel. A small business might use the first known source, last non-direct source, a primary source recorded by the sales team, or a self-reported answer at checkout. The right choice depends on the business and its data. The critical requirement is to disclose the selected method and apply it consistently.
Data-driven attribution can distribute fractional credit across several interactions. Google Analytics documents this behaviour in its attribution settings. Fractional credit helps analyse a journey, but it is not the same as counting unique customers for the CAC denominator.
For the Herotec calculator’s first release, channel CAC uses one primary channel assignment per unique customer. The user selects and documents the operational attribution rule. The calculator does not attempt to reproduce a platform’s multi-touch model or merge fractional attribution credits into a customer count. Those are different analytical tasks.
CAC vs. Cost per Lead and CPA
Cost per Lead divides spend by the number of leads meeting a defined qualification rule. Cost per Acquisition (CPA) may refer to the cost of a specific action, such as a registration, download, or form submission. CAC divides acquisition-related spend by new customers. Because the denominators differ, the metrics answer different questions.
A campaign can have low cost per lead and high CAC if few leads become paying customers. Use lead cost to evaluate lead generation, conversion rates to evaluate progression, and CAC to evaluate customer acquisition. Do not label all three simply as “customer cost.”
Interpret CAC with gross profit and customer lifetime value
Revenue is not profit. If a customer spends EGP 200, the business does not necessarily have EGP 200 available to recover acquisition cost. In Sami’s Chapter 1 case, a 30% gross margin on a EGP 200 order means EGP 60 gross profit before other relevant costs. CAC should be read against gross profit and expected customer behaviour, not against order revenue alone.
The book’s profit-based lifetime value formula is:
Profit LTV = Average Order Value × Gross Profit Margin × Purchases per Year × Customer Lifetime (Years)
The purpose of using gross profit margin is to compare the economic value of the customer with an acquisition cost paid to win that customer. Chapter 8 includes an educational Profit LTV example of EGP 450. The book then calculates LTV:CAC by dividing Profit LTV by CAC and presents 3:1 or higher as a guide. Treat that as the book’s operating guidance, not as a universal law or a guarantee of profitability for every sector.
A useful decision also considers payback time, cash flow, retention, returns, and concentration. A business may show an attractive LTV:CAC ratio but still face a cash-flow problem if recovery takes too long. A first order below CAC is not automatically fatal when repeat purchasing is measured and profitable. Test assumptions against actual customer cohorts.
A practical CAC calculation workflow
- Choose a reporting period and record its start and end dates.
- Define the customer acquisition event for the business model.
- Set the expense boundary. Decide whether the report includes advertising only or broader marketing and sales acquisition costs.
- Gather channel spend and shared acquisition expenses. Remove duplicate invoices and document allocations.
- Count unique first-time customers in the same period. Exclude returning customers, leads, visits, and clicks.
- Calculate blended CAC. Calculate channel CAC only for channels with both valid spend and attributed unique new-customer counts.
- Compare periods only when currency, cost scope, customer definition, and attribution rules are consistent.
- Interpret the result with first-order gross profit, Profit LTV, retention, and channel concentration.
With long sales cycles, a calendar-month ratio may pair spend with customers whose decision began earlier or omit customers who convert later. Supplement the period metric with cohort or lagged analysis, and explain the timing limitation rather than changing the denominator silently.
Use the Herotec CAC Calculator
The Herotec calculator records the period, currency, costs, unique new customers, channel spend, attribution counts, and attribution method. It presents blended and channel CAC when data is sufficient. Shared costs are included in blended CAC when selected, not allocated automatically across channels.
Download the CAC workbook for offline use. It includes calculation, comparison, guidance, and test-case worksheets.
Download the English CAC Calculator (Excel)
Enter the period, currency, channel spend, unique customers assigned to each channel, and the total unique new-customer count. Add shared acquisition costs that belong in the blended scope and document what they cover. Do not replace the denominator with orders or leads.
The calculator warns when channel counts exceed the total, when data is incomplete, or when the denominator is zero. It withholds channel CAC when a channel has no attributed customers. A prior-period comparison is shown only when currency and expense scope match. Calculations run in the browser; local save is optional. The workbook provides the same core inputs offline, with space for source and attribution notes.
Common CAC calculation mistakes
- Dividing spend by orders, leads, visits, or clicks instead of unique new customers.
- Using different periods for spend and customer count.
- Comparing ad-only CAC with fully loaded CAC without flagging the difference.
- Counting one customer in two channels or allocating shared costs without a method.
- Treating revenue as profit when assessing payback or LTV.
- Calling lower CAC “better” without checking customer quality, retention, and concentration.
- Treating an illustrative example or another company’s benchmark as your target.
Frequently asked questions
Can CAC be calculated when there are no new customers?
No per-customer value exists when the denominator is zero. Report it as not calculable, not zero.
Should sales salaries and commissions be included?
Include the acquisition-related portion when your policy allows it and the allocation is supportable. State the rule before comparing reports.
Should channel-attributed customers add up to total new customers?
In a primary-channel report, the total assigned across channels should not exceed total unique new customers. It can be lower when some sources are unknown or unassigned. Multi-touch analytics may distribute fractional credit across several touchpoints, but those fractional credits should not be treated as unique customer counts.
How should two periods be compared?
Use the same currency, scope, customer definition, attribution method, and comparable windows. For long sales cycles, supplement calendar-period CAC with cohort or lagged analysis.
Does a lower channel CAC mean that channel is the best one?
No. Compare first-order margin, retention, repeat purchase, and channel dependence. A cheap customer may be less profitable over time.
Make CAC a decision metric, not just a dashboard number
CAC is useful when its numerator and denominator are defined, costs are transparent, periods align, and attribution is consistent. Start with blended CAC; add channel reporting only when assignments are reliable. Read the result with gross profit, Profit LTV, payback, retention, and concentration.
Safe growth is not the lowest CAC at any price. It is knowing what it costs to attract the right customer, what profit that customer contributes over time, and whether the acquisition method is sustainable.
Explore Safe Growth Engineering on Amazon. The English edition of the book connects growth decisions with practical measurement and risk-aware execution.
Get the English Edition on Amazon
References
- Mohamed Fathy, Safe Growth Engineering: A Practical System to Grow with Confidence and Withstand Risk, Chapter 1: Growth Diagnosis, pp. 6–11; Chapter 8: Measure Everything, pp. 63–65. First edition, 2026.
- Herotec, Functional Specifications – Risk Management, Growth Intelligence & Safe Growth Decision Tools, v1.0, November 2026, Growth Intelligence formulas and GI-T01.
- Stripe – Customer Acquisition Cost in SaaS.
- Shopify – How to Calculate Customer Acquisition Cost.
- Google Analytics Help – Select attribution settings.