
G-P04 | SAFE GROWTH ENGINEERING
A rise in monthly sales can hide a fragile customer base. New orders may be arriving while the people who bought from you earlier are quietly disappearing from the picture. Customer retention analysis answers a different question from acquisition reporting: how many members of a defined earlier cohort came back and completed a meaningful action within a stated follow-up window?
This guide sets out a practical cohort-based method for a small business. It explains the calculation, shows how to compare like-for-like groups, and turns the result into a measured improvement cycle—without treating repeat orders, loyalty and churn as interchangeable terms.
What this guide covers
- Defining a customer cohort, a qualifying return event and a follow-up window.
- Calculating retention from unique customers rather than transactions.
- Comparing cohorts only when their measurement rules match.
- Choosing practical retention experiments and interpreting their limits.
1. What Customer Retention Rate actually measures
Customer Retention Rate is the share of customers from a specified prior cohort who return and complete a qualifying action during a defined measurement window. The return event might be a second purchase, a subscription renewal or a meaningful product activity. The key is that the people counted in the numerator must belong to the original cohort in the denominator.
This is why a growing sales total is not enough to demonstrate a healthy customer relationship. A campaign may bring many first-time buyers into a shop. A seasonal promotion may lift orders for a few weeks. Neither result tells you whether customers who bought earlier returned. Separating new customers from returning members makes that difference visible and helps a small business understand whether the first transaction is becoming an ongoing relationship.
The return event must represent meaningful value: a second purchase for a retailer, renewal for a subscription, or a defined core action for a digital service. A login or message open may be too weak unless deliberately chosen as the business’s qualifying event.
2. Define the prior cohort before opening the spreadsheet
A cohort is a group of customers who share a clearly stated entry rule. A small retailer might group people by their first completed purchase in a 30-day acquisition period. A subscription business might group customers by their first paid start date. A digital service might use the date on which a user first completes its core activation event. The rule should be explicit, repeatable and stable from one comparison to the next.
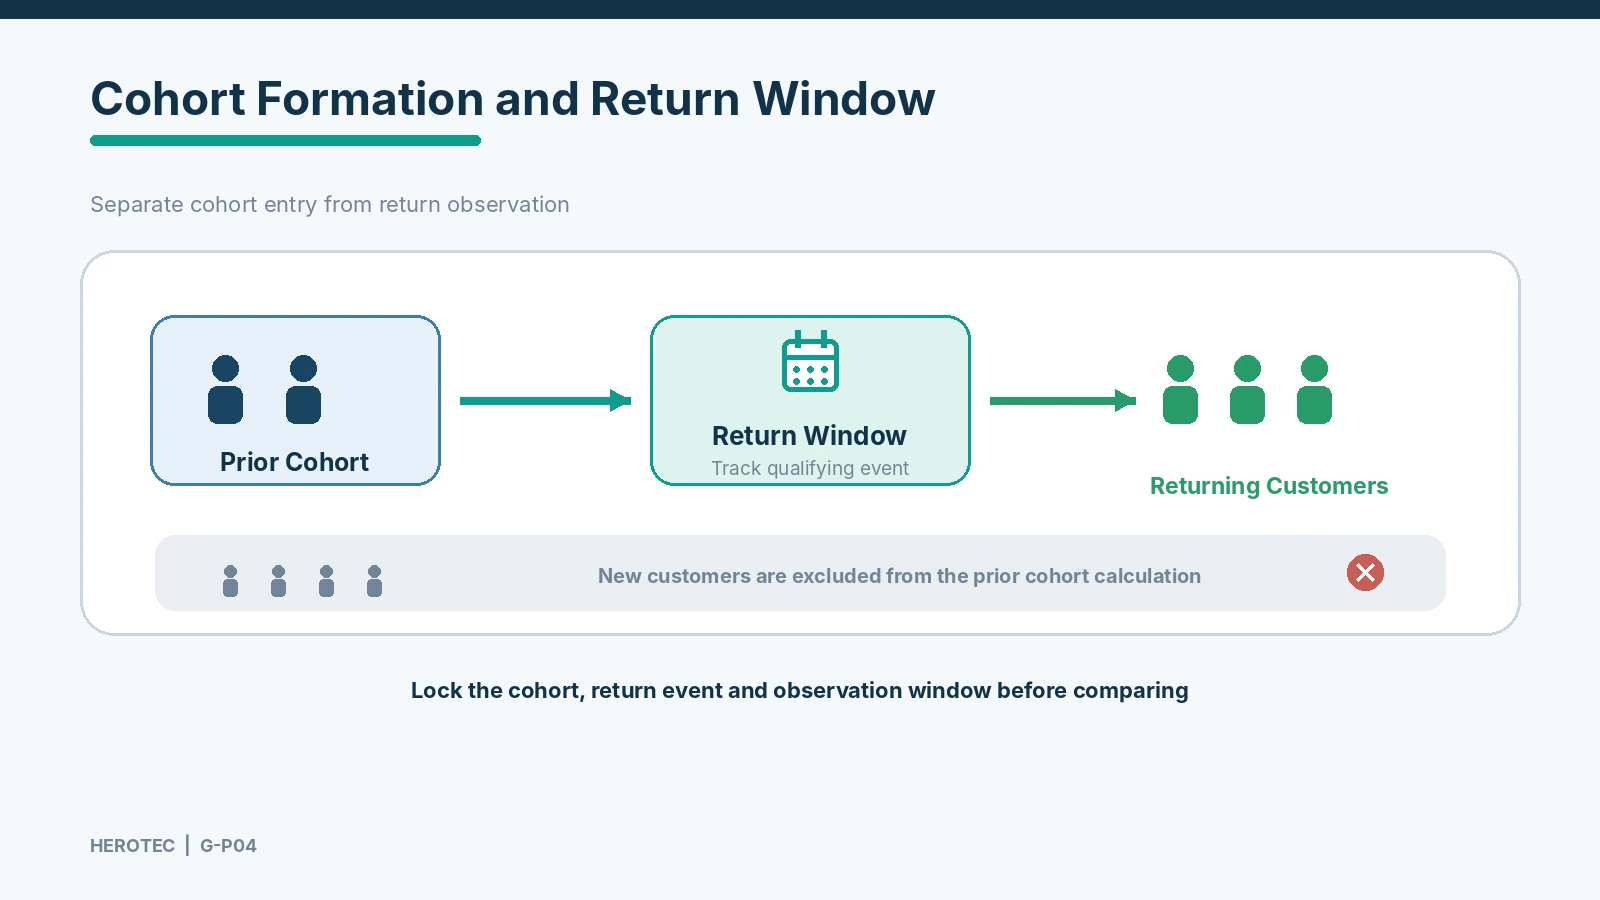
Write down the cohort start and end dates, the number of unique customers in it, the qualifying return event, the follow-up dates, the follow-up duration, the data source and the method used to deduplicate people. A point-of-sale export may count orders, while a customer relationship system counts customer records. Combining those totals without matching unique customer IDs can inflate the number of people who returned.
Choose a window that reflects the natural purchase, renewal or usage cycle. A customer who buys a durable item may not need another one next week. A monthly subscription, by contrast, has a predictable renewal checkpoint. A service renewed annually needs a longer observation period. A 30-day window and a 90-day window do not measure the same opportunity to return, so do not place them in the same trend line as if they were equivalent.
3. The governing Customer Retention Rate formula
The numerator is the number of unique customers from the original cohort who completed the chosen return event during the follow-up window. The denominator is the number of unique customers in that original cohort. New customers acquired during follow-up are excluded from both counts. Orders, visits and event totals are not substitutes for people.
Use this sequence:
- Freeze the original group. Apply the entry rule to the acquisition period and count unique customers.
- Name the return event. Choose purchase, renewal or a defined activity that represents meaningful value.
- Set the observation window. Record its start and end dates and make its duration consistent for comparisons.
- Match returning members. Identify which original cohort members completed the event, using unique customer identifiers.
- Calculate the percentage. Divide returning unique customers by the original cohort size and multiply by 100.
Do not calculate a rate when the original cohort size is zero, the observation window is missing, or the return event has not been defined. Reject counts where returning customers exceed the original cohort size. These are not cosmetic validations: they protect the meaning of the numerator and denominator.
Some systems calculate retention from customer balances at the start and end of a period after adjusting for new acquisitions. That is a related method, not automatically the same as a fixed prior-cohort calculation. This article and analyzer use the Herotec prior-cohort formula; do not combine the methods in one trend.
4. A hypothetical example: Northline Supply
The following scenario is fictional and is provided only to demonstrate the method; it is not market data. Imagine a small online shop called Northline Supply that sells reusable outdoor and travel accessories. The owner defines a cohort as customers who completed their first purchase during a 30-day acquisition period. The group contains 240 unique customers. The chosen return event is a second completed purchase in the next 30-day follow-up window.
When the owner checks the customer records, 54 members of the original group made at least one qualifying purchase during the follow-up window. Some of those customers placed more than one order, but the numerator is still 54 unique people, not the total number of orders.
54 ÷ 240 × 100 = 22.5%
Customers who did not return in the window = 240 − 54 = 186
Suppose the shop also acquired 63 first-time buyers during the follow-up window. Those 63 people are excluded from the numerator because they were not members of the original cohort. They are also excluded from the denominator. A report showing 117 buyers in the later period does not mean 117 original customers returned: the total may include the 54 returning cohort members and new buyers, among other eligible groups.
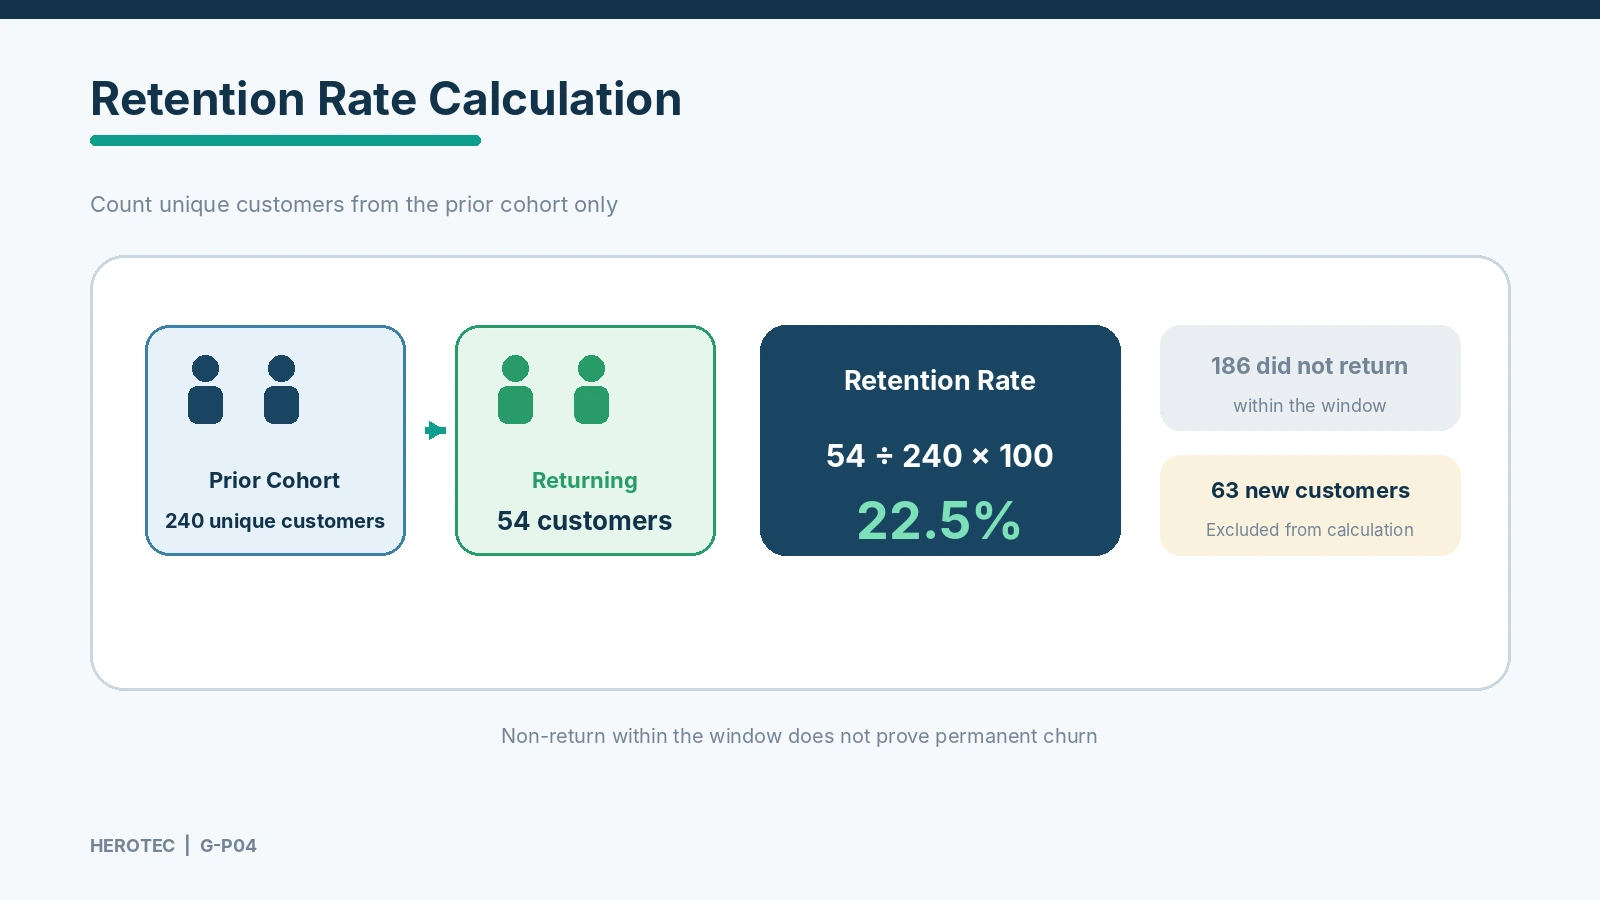
The result means that 54 out of the 240 customers in this defined group returned within the selected 30-day period. It does not mean 22.5% of every customer the shop has ever served is active, nor does it measure satisfaction, recommendation intent or emotional loyalty. The rate is meaningful only alongside the cohort definition, return event, window and source.
5. When is Customer Cohort Analysis a fair comparison?
Cohort analysis helps reveal whether customers acquired at different times behave differently after their first interaction. But a comparison is misleading when one group is measured for 30 days and another for 90 days, when one counts renewals and another counts app opens, or when the sources use different deduplication rules. A chart cannot repair inconsistent definitions.
For a fair comparison, keep the cohort entry rule, grouping frequency, follow-up duration, return event, data source and unique-customer method consistent. Record channel or first product when needed to explain differences; separate results whenever a core definition changes.
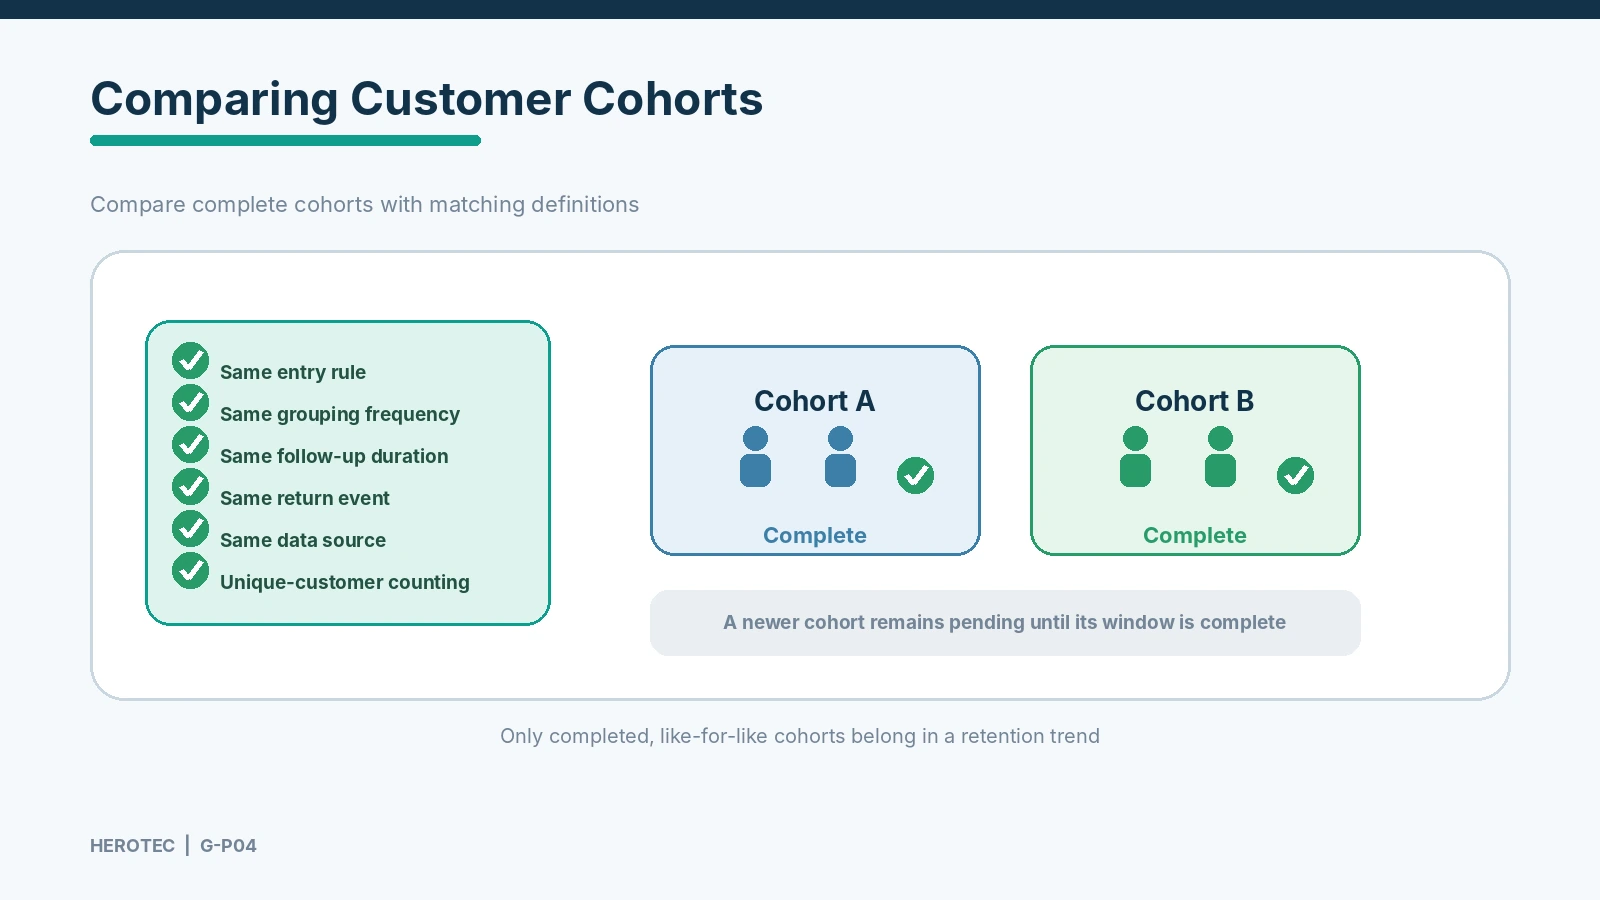
Draw a trend only after at least two complete, comparable cohorts are available. Mark a newer, unfinished cohort as pending; missing observation time is not customer loss. Record the last refresh date and source.
Bilingual Excel Workbook
Use the workbook to record customer cohorts, return windows and measurement results, then review comparisons using consistent definitions and observation periods. It includes a start guide, Arabic and English cohort sheets, and a definitions sheet.
6. Retention is not the same as Repeat Purchase Rate, loyalty or churn
Customer Retention Rate
In this guide, it is the percentage of members of a defined prior cohort who return during a stated follow-up window. It requires an original cohort, a qualifying event and a complete observation period.
Repeat Purchase Rate
This term commonly describes the share of customers who have purchased more than once within a selected customer base or time period. Its denominator and time basis can vary by system. It is not automatically the same as cohort retention. The two measures align only when the cohort entry rule, follow-up window, purchase event and unique-customer counting method align. One person placing three repeat orders is still one returning customer for this retention calculation.
Customer Loyalty
Loyalty is broader. It can include preference, trust, willingness to recommend and a decision to stay when alternatives are available. A repeat purchase alone does not prove loyalty: a customer may be responding to a temporary discount, lack of alternatives or a one-off need. Conversely, a satisfied customer may not need to buy again during a short observation window.
Customer Churn
Churn describes a customer becoming inactive or ending a relationship according to a defined behavioral and time rule. Not returning within 30 days is not automatically churn, especially for products with longer repurchase cycles. Do not simply subtract this cohort retention rate from 100% and label the remainder churn unless the definitions and observation window explicitly support that interpretation. The analyzer reports non-returners in the window, not confirmed permanently lost customers.
7. Practical ways to improve retention without permanent discounting
Investigate why customers did not return before choosing a promotion. Review the first-use and post-purchase journey: did the item arrive as promised, was setup clear, and could the customer get help when needed? Removing friction can be more sustainable than reducing the price.
A. Help customers reach value early
Test a concise welcome message, a setup checklist or a practical usage guide after the first purchase. For subscriptions, early onboarding may help customers experience the service’s value. Measure the meaningful action, not simply whether a message was sent or opened.
B. Match contact timing to the natural cycle
A replenishment reminder may suit consumables; a subscription needs clear information before renewal. Keep messages relevant and proportionate, and respect marketing permissions and unsubscribe choices. Excessive reminders can damage the relationship.
C. Fix recurring friction
Group complaints, returns, delivery delays and repeated support questions by frequency. Then test one operational fix. If late delivery is common, measure fulfilment against the promised date. If instructions are confusing, test a better guide. Do not credit marketing for a change that may have come from operations.
D. Test benefits without eroding margin
Better service, faster support or a relevant reward may encourage a return, but permanent discounting can weaken margin and train customers to wait for a lower price. Define the target outcome in advance: returning unique customers, incremental revenue or contribution margin. Retention can influence CAC and Profit LTV interpretation, but it is not a replacement for either metric or its formula.
Use a disciplined improvement loop
Chapter 9 of Safe Growth Engineering on Amazon sets out four steps: Observe, Hypothesize, Test and Learn. Identify a cohort pattern, write a testable hypothesis, change one variable, and review the result after the follow-up window is complete. The book suggests two-to-four-week cycles as an operating guide, not a universal timeline; a longer purchase cycle requires a longer observation period.
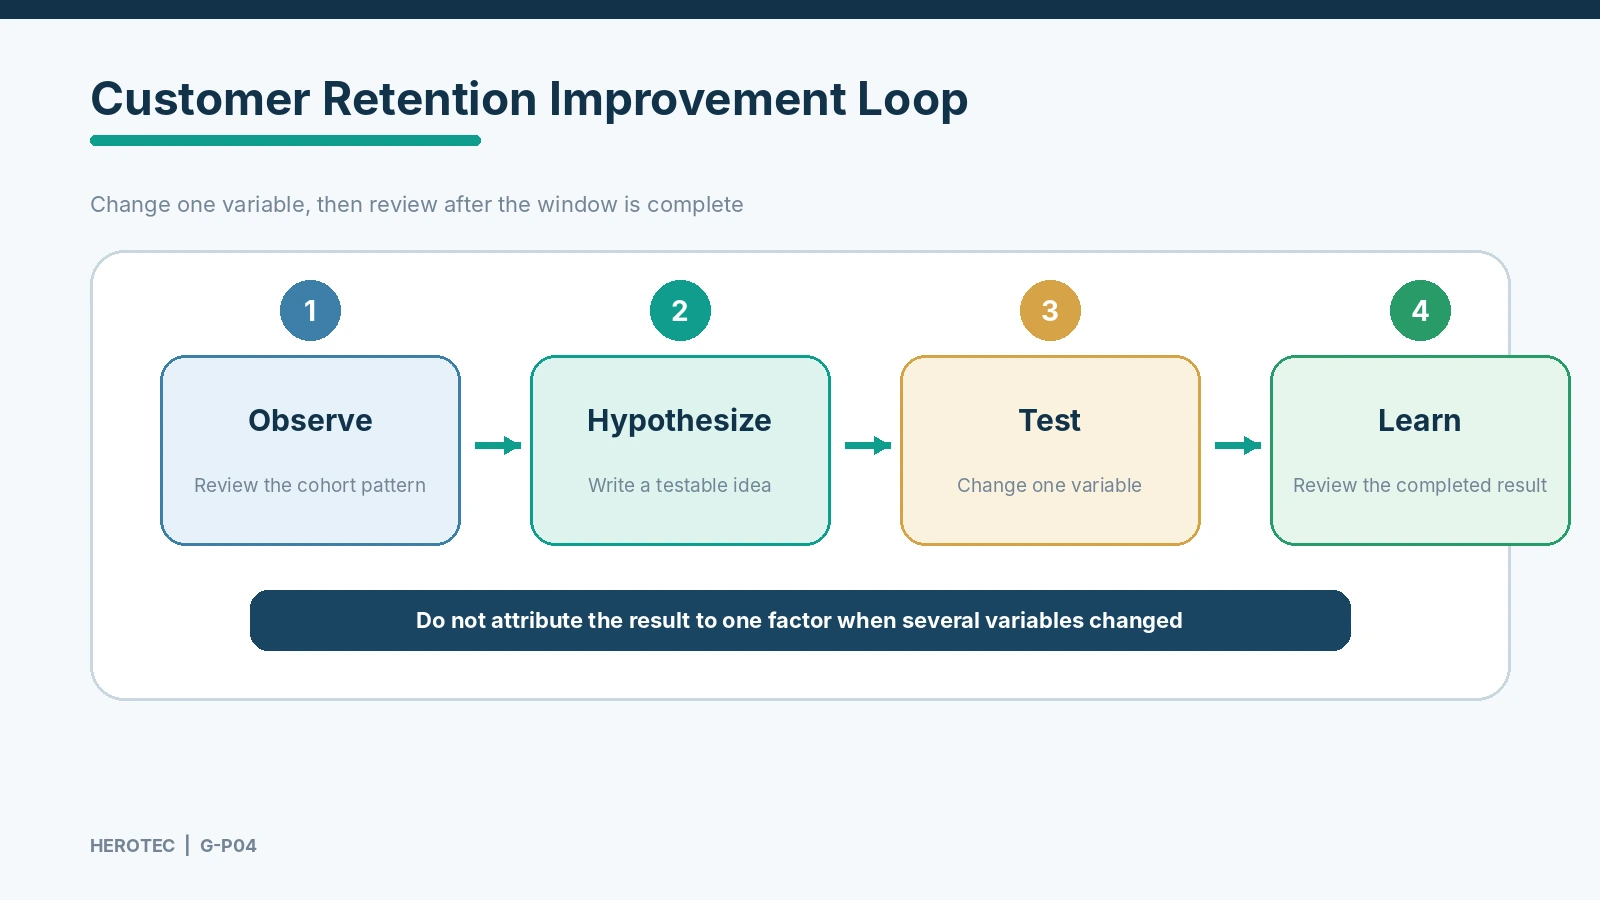
Record the cohort, window, source, change and result. When price, delivery and messaging all change together, the effect cannot confidently be assigned to one factor. A failed test is still useful when its learning is documented.
8. Use the Customer Retention Analyzer
The analyzer below applies the cohort formula to one group and lets you add other groups for comparison when their measurement rules match. Enter the original cohort size, the number of unique members who returned, cohort dates, return-window dates, the data source and the qualifying event. When the event is a custom activity, describe it precisely.
The result shows the rate, non-returning count, denominator and interpretation limits. It blocks zero cohort size, negative or fractional counts, returning customers above cohort size, invalid dates and overlapping cohort/return windows. It withholds trends for one cohort or unmatched comparison rules.
Use aggregate data only: count unique customers from the original cohort. Do not include first-time customers acquired during the follow-up window.
9. Common errors and important limitations
- Counting orders instead of people: multiple orders from one customer do not create multiple returning customers. Deduplicate with a stable identifier.
- Adding new customers to the prior cohort: a customer acquired during follow-up belongs to a different acquisition group and is excluded from both counts.
- Leaving the event undefined: a purchase, renewal and app activity are not interchangeable. State the qualifying event before extracting the data.
- Using an incomplete window: a customer who has not returned yet may still return later.
- Comparing unlike cohorts: different follow-up durations, event definitions, data sources or counting units make a direct trend misleading.
- Treating 25% as a universal benchmark: the book presents an initial guide in its own context, not a global standard. Interpret it against sector, purchase cycle, cohort definition and historical performance.
- Labelling every non-returner as churned: delayed demand is not proof of a permanently ended relationship.
- Attributing improvement without evidence: change one factor per test where possible and record what remained constant.
Display four details beside every result: cohort definition, return event, follow-up duration and data source. If one is missing, mark the result incomplete or postpone the comparison. A precise-looking percentage is not useful when a reader cannot reconstruct what it measures.
10. Frequently asked questions
Is 22.5% a good retention rate?
It is the example calculation: 54 of 240 customers returned in the stated window. Whether it is healthy depends on the sector, buying cycle, event and observation period. Compare like-for-like cohorts.
Can I count orders instead of returning customers?
No. The formula uses unique customers. If 20 people place 35 repeat orders, the numerator is 20. Order frequency can be analyzed separately.
Is Repeat Purchase Rate the same as Customer Retention Rate?
Not necessarily. The denominator, group entry rule and measurement window may differ. Use the terms interchangeably only when the definitions are explicitly aligned.
Does every customer who did not return count as churn?
No. A customer may have no need to buy again inside the selected window. Define churn separately using a time and activity rule that fits the business model.
How often should a small business review retention?
Choose a cadence that fits the purchase or renewal cycle and the amount of data available. A monthly review may suit some shops; a service with a longer cycle needs a different schedule. Only compare groups after their observation windows are complete.
Conclusion: measure cohort returns, not sales noise alone
Retention is a defined measure linking a prior cohort to a return event within a stated window. Counting unique customers, excluding new acquisitions and comparing like-for-like cohorts makes the result interpretable.
Start with one complete cohort, calculate its baseline, then test one change grounded in an observed customer problem. Avoid defaulting to discounts or changing many variables at once.
Build a connected growth system
Explore the Safe Growth Engineering method and tools for interpreting business indicators and turning them into practical decisions.
References
- Mohamed Fathy, Safe Growth Engineering, first edition, 2026: Chapter 1, “Diagnose Your Current Position,” pp. 8–11; Chapter 8, “Measure Everything,” pp. 68–70; Chapter 9, “Improve the Growth Engine Continuously,” pp. 76–79.
- Herotec Training & Consulting, Functional Specifications – Risk, Growth & Decision Tools, version 1.0, 13 November 2026: general inputs, p. 18; core formulas, p. 19; warning guidance, p. 23; GI-T06 acceptance test, p. 24.
- Shopify Help Center, “Analytics data points (fields) reference,” defines cohort customer retention as the percentage of customers in a cohort who placed an order in a given period, source, accessed 20 November 2026.
- Shopify Help Center, “Customers reports – Customer cohort analysis,” explains grouping customers by first-order date and configuring cohort definitions, intervals and comparisons, source, accessed 20 November 2026.
- Shopify Enterprise, “Ecommerce Customer Retention Strategies (2026),” presenting a start/end customer-balance formula adjusted for new acquisitions—a related but different method from the prior-cohort formula used here, source, accessed 20 November 2026.
Method note: Some platforms and articles use other retention definitions, i