
Safe Growth Engineering | G-P02
A customer who places a large first order is not automatically more valuable than one who starts small and returns consistently. First-order revenue tells you what happened in one transaction. It does not tell you how much gross profit the relationship may generate, how often the customer may buy again, or how long the relationship may last.
Customer Lifetime Value (CLV) connects those behaviors to customer economics. Used carefully, it gives business owners and marketing teams a more complete view of customer profitability and a stronger basis for evaluating acquisition spending. Used carelessly, it can overstate value by confusing revenue with profit or presenting assumptions as facts.
1. Why first-order revenue is not enough
Two customers can spend the same amount on their first purchase and create very different economics for a business. One may never return. Another may make several purchases each year and remain active for multiple years. Looking only at the first transaction hides that difference.
This matters when you decide how much to invest in acquisition, which customer segments to prioritize, and whether retention initiatives are producing economic value. A campaign can generate new customers and still weaken cash flow if acquisition costs are high and customers do not return often enough.
Lifetime value is not a promise that every customer will behave like the average. It is a model built from observed behavior or explicit assumptions. The quality of the result depends on the quality and consistency of those inputs.
2. What is Customer Lifetime Value?
Customer Lifetime Value estimates the economic value generated by a customer over the duration of the relationship. In the simplified repeat-purchase model used here, the estimate is driven by average order value, gross profit margin, purchase frequency per year, and customer lifetime in years.
You may see CLV, LTV, or Customer Lifetime Value used interchangeably. The important distinction is not the acronym; it is the value being measured. Revenue-based lifetime value and profit-based lifetime value answer different questions and should not be mixed in a performance report.
This article uses a practical, non-discounted model. It does not calculate the present value of future cash flows, and it does not automatically deduct every customer service, retention, fulfilment, or operating expense. Profit LTV here means gross-profit contribution based on the gross margin you enter—not net profit.
3. Revenue LTV vs. Profit LTV
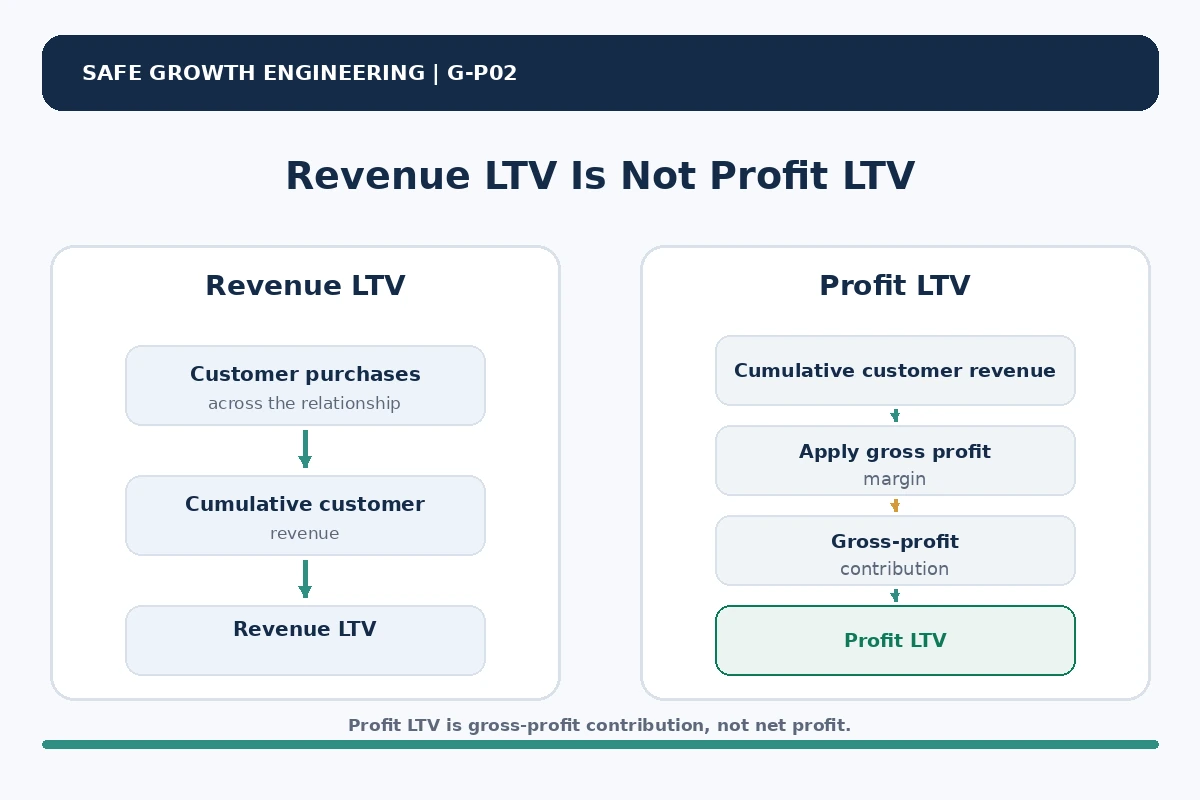
Revenue LTV estimates the total revenue generated by a customer across the relationship. It is useful for understanding cumulative sales, but it includes amounts that the business must spend to produce or deliver the product or service.
Profit LTV applies gross profit margin to that revenue estimate. It represents the gross-profit contribution before acquisition cost and any other expenses not already included in the gross-margin definition. This is the appropriate LTV figure to compare with CAC in the Herotec model.
Revenue LTV
Cumulative customer revenue before direct product or service costs.
Profit LTV
Cumulative gross-profit contribution after applying gross margin, but before CAC and other costs outside that margin.
Comparing revenue with CAC makes the economics look stronger than they are. Revenue is not the amount available to cover acquisition spending. Gross profit is closer to the contribution that can fund CAC, although a fuller profitability model may also need to account for servicing and retention costs.
4. Customer Lifetime Value formula and inputs
Revenue LTV = AOV × Purchases per Year × Customer Lifetime (Years)
Profit LTV = AOV × Gross Profit Margin × Purchases per Year × Customer Lifetime (Years)
LTV:CAC = Profit LTV ÷ CAC
- Average Order Value (AOV): Average revenue per completed order. A common calculation is revenue from orders divided by the number of orders during the selected period.
- Gross Profit Margin: The share of revenue remaining after the direct costs included in your gross-margin definition. Enter 35% as 0.35, not 35.
- Purchases per Year: Average purchases per customer in a year. Use a consistent customer base and measurement window; do not confuse orders with unique customers.
- Customer Lifetime: Average active relationship duration in years. If the relationship has not fully elapsed, the input is an estimate rather than a realized historical value.
- Customer Acquisition Cost (CAC): The average cost of acquiring one new customer under a defined expense scope, attribution rule, and period. Use a consistent currency and definition when comparing CAC with LTV.
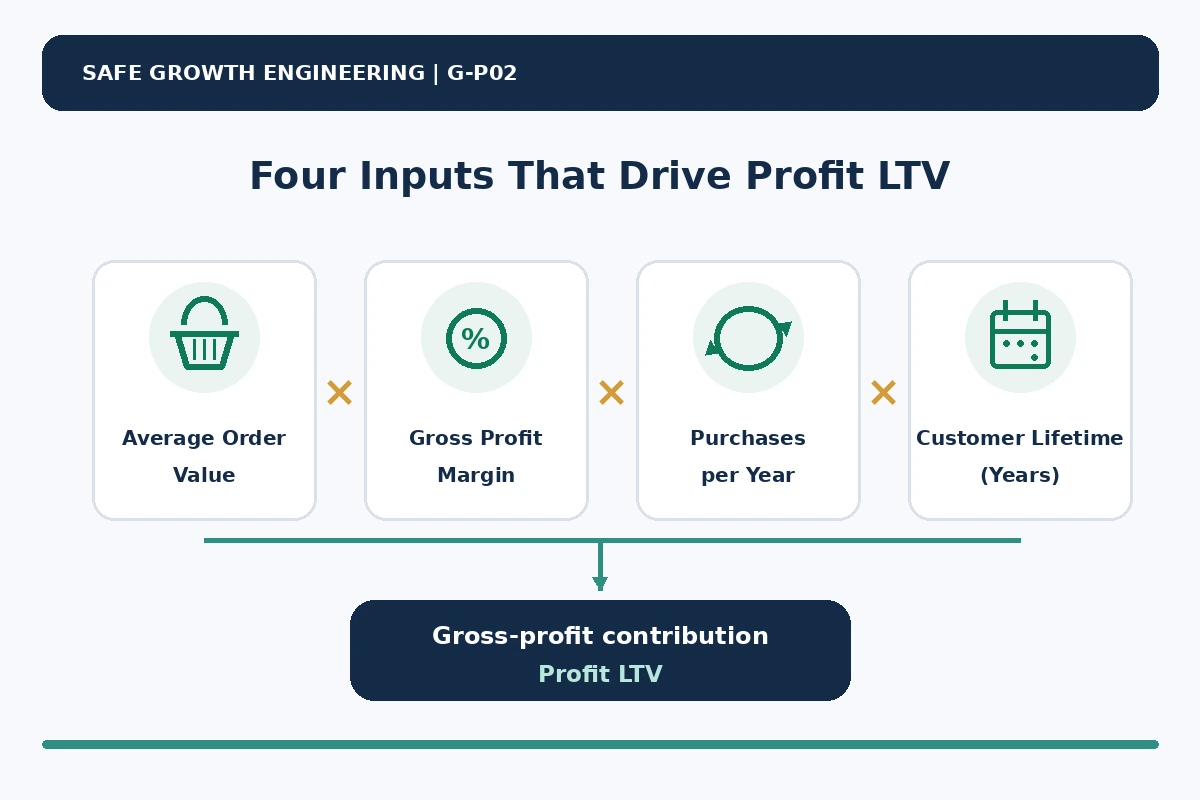
Keep the time units aligned. Annual purchase frequency must be multiplied by lifetime in years. If your source data is monthly, convert it to an annual basis consistently before applying this formula.
5. Worked examples: from revenue to gross-profit value
The book example
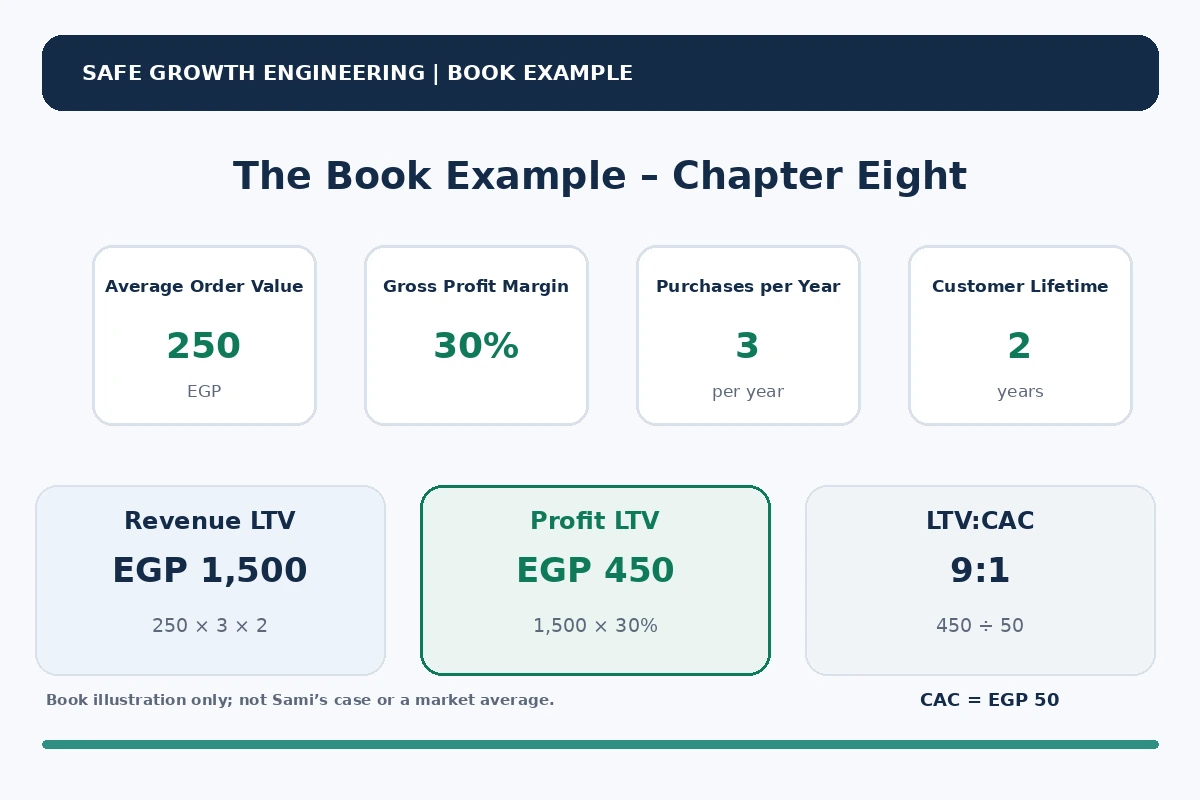
The eighth chapter of Safe Growth Engineering uses an educational example with an average order value of EGP 250, a 30% gross profit margin, three purchases per year, and a two-year customer lifetime.
| AOV | EGP 250 |
|---|---|
| Gross Profit Margin | 30% |
| Purchases per Year | 3 |
| Customer Lifetime | 2 years |
| Revenue LTV | 250 × 3 × 2 = EGP 1,500 |
| Profit LTV | 1,500 × 30% = EGP 450 |
At a CAC of EGP 50, the ratio is 450 ÷ 50 = 9:1. These are the expected outcomes of acceptance tests GI-T02 and GI-T03 in the Herotec Functional Specifications.
A hypothetical homeware store
Consider a hypothetical store with an AOV of $80. A typical customer purchases four times a year and remains active for 1.5 years. At a 35% gross margin, Revenue LTV is $80 × 4 × 1.5 = $480. Profit LTV is $480 × 35% = $168.
If CAC is $40 in the same currency and under a compatible measurement scope, LTV:CAC is $168 ÷ $40 = 4.2:1. This is an illustrative scenario, not an industry benchmark or a forecast for a real store.
6. What the Sami case teaches about customer economics
In Chapter One of Safe Growth Engineering, Sami runs an online store selling kitchen supplies. His diagnosis shows that only 13% of customers are repeat customers, 72% of sales depend on Facebook advertising, and CAC increased from EGP 61 to EGP 85 over six months. His average order value is EGP 200, with a 30% gross margin, so the first order generates EGP 60 in gross profit.
At an EGP 85 CAC, the first-order gross profit does not cover acquisition cost. That does not prove every acquired customer is unprofitable over the full relationship; a customer may return and generate additional contribution. However, the book does not provide the annual purchase frequency and customer lifetime needed to calculate Sami’s complete LTV. We should not invent those values or substitute the separate Chapter Eight example.
The practical lesson is to measure repeat behavior and cohort performance before assuming that future purchases will recover acquisition spending. Low repeat purchase and dependence on one channel are also reasons to examine post-purchase experience, retention, and channel concentration together.
7. How to interpret the LTV:CAC ratio
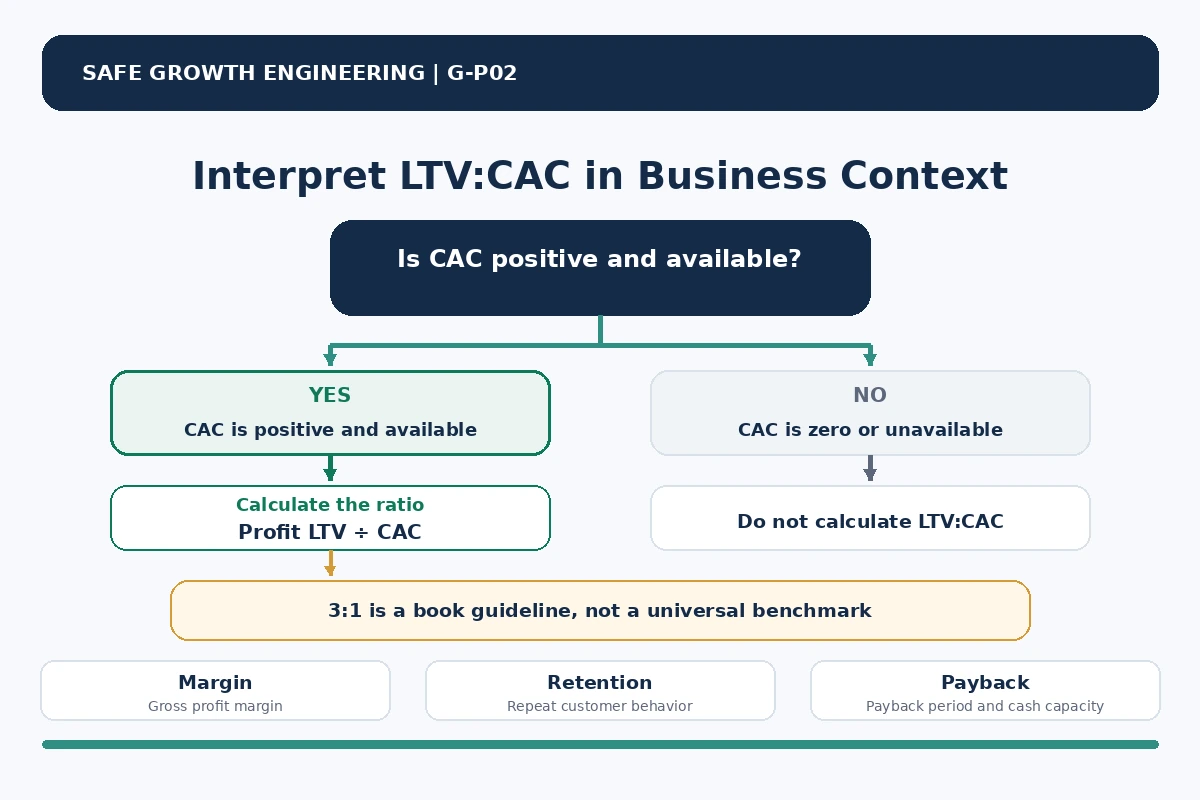
The ratio compares Profit LTV with the cost of acquiring one customer. A 3:1 ratio means the model estimates three units of gross-profit contribution over the relationship for every one unit spent to acquire the customer.
Safe Growth Engineering presents 3:1 or higher as an operating guideline. The Functional Specifications treat a result below 3:1 as an amber warning that calls for analysis of acquisition cost, margin, and retention—not as an automatic verdict that the business has failed. It is not a universal law for every industry, business model, or cash position.
Before interpreting the ratio, check that LTV and CAC use compatible currencies, customer definitions, time assumptions, and cost scopes. Then consider cash payback: when does gross profit actually recover the acquisition cost? A strong long-term ratio can still create a cash-flow problem if the payback period is too long for the business to finance.
Do not calculate LTV:CAC when CAC is zero or unavailable. If CAC is missing, show LTV values without a ratio. If CAC is zero, report the ratio as unavailable rather than displaying an infinite value that could mislead the reader.
8. Use the Profit LTV Calculator
The calculator accepts AOV, gross margin, purchases per year, customer lifetime, and optional CAC. It reports Revenue LTV and Profit LTV separately, shows the gross-profit difference, and compares LTV with CAC only when a positive CAC value is available in the same currency.
Record the data period and source, then select Historical or Estimated. Historical means the inputs come from historical records; it does not mean a future customer lifetime has already been realized. Estimated means one or more inputs or the relationship duration relies on assumptions.
All calculations run in the browser. You can print a report showing the inputs, outputs, assumptions, and validation messages. Load the book example to reproduce EGP 450 Profit LTV and a 9:1 ratio, then clear it before entering your own business data.
Companion Excel workbook: Download the Customer Lifetime Value Calculator – English Excel workbook. Use it to enter your business assumptions and review Revenue LTV, Profit LTV, and LTV:CAC when a positive CAC is available.
9. Common Customer Lifetime Value mistakes
- Using revenue instead of gross profit: This overstates the value available to cover acquisition spending.
- Mixing time units: Annual purchase frequency must align with lifetime measured in years.
- Counting orders as new customers: Repeat orders belong to the same customer relationship; they are not new acquisitions.
- Using an unsupported lifetime assumption: Define the cohort, observation window, and method, or label the duration as estimated.
- Comparing incompatible currencies or scopes: Do not compare a dollar CAC with an LTV in another currency or use different cost definitions without reconciliation.
- Calling gross-profit LTV net profit: Costs outside the gross-margin definition are not automatically deducted.
- Treating 3:1 as a universal rule: It is a guideline in the book, not a guarantee or a fixed threshold for every business.
10. Practical levers to improve Profit LTV
Work through the four inputs rather than relying on a single growth tactic. You may increase AOV through relevant bundles or complementary products, but monitor discounts and fulfilment costs so that higher order value does not reduce margin. You can improve purchase frequency through product availability, useful replenishment reminders, post-purchase support, and loyalty initiatives whose incremental effect is measured.
Customer lifetime depends on whether customers continue to receive value. Reliable quality, a consistent experience, clear service recovery, and relevant follow-up can support retention. The right approach varies by product category, replacement cycle, seasonality, and buying frequency; do not assume every business can extend customer lifetime in the same way.
Finally, protect gross margin. A promotion may increase Revenue LTV while reducing Profit LTV. Evaluate retention campaigns, bundles, discounts, and service improvements using contribution—not revenue alone—and compare cohorts with consistent definitions.
11. A decision checklist
- Define the measurement period, source, and active-customer rule.
- Calculate AOV using a consistent treatment of refunds and discounts.
- Document which direct costs are included in gross margin.
- Measure purchase frequency and lifetime from a suitable cohort, or label them as estimates.
- Calculate Revenue LTV and Profit LTV separately.
- Enter compatible CAC and calculate the ratio only when CAC is positive and available.
- Review payback, cash capacity, retention, and channel concentration before scaling acquisition.
Frequently asked questions
Are LTV and CLV the same?
They are commonly used to refer to customer lifetime value. State whether your report measures revenue or gross-profit contribution, and use the definition consistently.
Should I compare CAC with Revenue LTV or Profit LTV?
Use Profit LTV. CAC should be compared with the expected gross-profit contribution, not with top-line revenue that still includes direct costs.
Is a 3:1 LTV:CAC ratio right for every business?
No. It is an operating guideline in Safe Growth Engineering, not a universal standard. Interpret it alongside margin, retention, cash flow, and payback.
What if I do not know customer lifetime?
Start with a suitable cohort analysis or a conservative, clearly labelled estimate. Update the model as more customer history becomes available.
Conclusion: measure the relationship, not just the first transaction
Customer Lifetime Value moves growth decisions beyond first-order sales. Separate revenue from gross profit, document purchase frequency and relationship duration, and use Profit LTV when comparing customer value with CAC. When the inputs are estimates, make the assumptions visible and avoid presenting the ratio as a guarantee of profitability.
Get Safe Growth Engineering: A Practical System to Grow with Confidence and Withstand Risk on Amazon and apply a connected approach to marketing, sales, and risk decisions.
References
- Mohamed Fathy, Safe Growth Engineering, Chapter One: Growth Diagnosis, pp. 6–11; Chapter Eight: Measure Everything, pp. 63–66, First Edition, 2026.
- Herotec, Functional Specifications – Risk, Growth & Decision Tools, Version 1.0, November 2026: Growth Intelligence formulas, warning rules, and GI-T02/GI-T03 acceptance tests.
- American Marketing Association – Customer Lifetime Value Guide & Calculator.
- University of North Carolina Wilmington – LTV Calculations.