
Do not change the ads until you know where buyers stop
A campaign can attract attention and generate traffic, yet produce fewer purchases than expected. Before blaming the advertisement or increasing its budget, ask: at which measured step do people stop progressing towards purchase?
Sales funnel analysis turns that question into a sequence of observable transitions. It shows how many people progress from one defined stage to the next, the proportion who move forward, and the number who do not. It does not, by itself, explain why they stopped. The cause might relate to audience fit, the promise made in an advertisement, product information, price, stock availability, shipping, payment, or the follow-up process.
This guide helps small businesses define a funnel, make data comparable, calculate conversion and leakage, investigate the weakest transition, and choose a testable action. The included browser-based analyzer keeps calculations on the visitor’s device.
What you will be able to do
- Define each stage with a specific event rather than a vague label.
- Distinguish a low conversion rate from a large absolute number of people who did not progress.
- Recognise when channel or period comparisons are invalid because definitions or measurement windows differ.
- Identify where to investigate without treating a percentage as proof of cause.
- Choose one measurable intervention and review it using the same counting rules.
What is a sales funnel?
A sales funnel measures the steps people take from a first relevant interaction to a completed purchase. It is called a funnel because fewer people usually continue as steps become more specific. That reduction is not automatically a failure: not everyone who sees an offer has the need, timing, budget or intent to buy.
Marketing Funnel, Sales Funnel and Conversion Funnel overlap, but their boundaries vary. Marketing often emphasises reach and early engagement, sales progression towards a sale, and conversion measurable website or app events. State which model you use and keep it stable.
The broader Customer Journey may continue beyond purchase into product use, service and retention. This four-stage model ends at purchase; retention and repeat purchasing belong in a separate analysis.
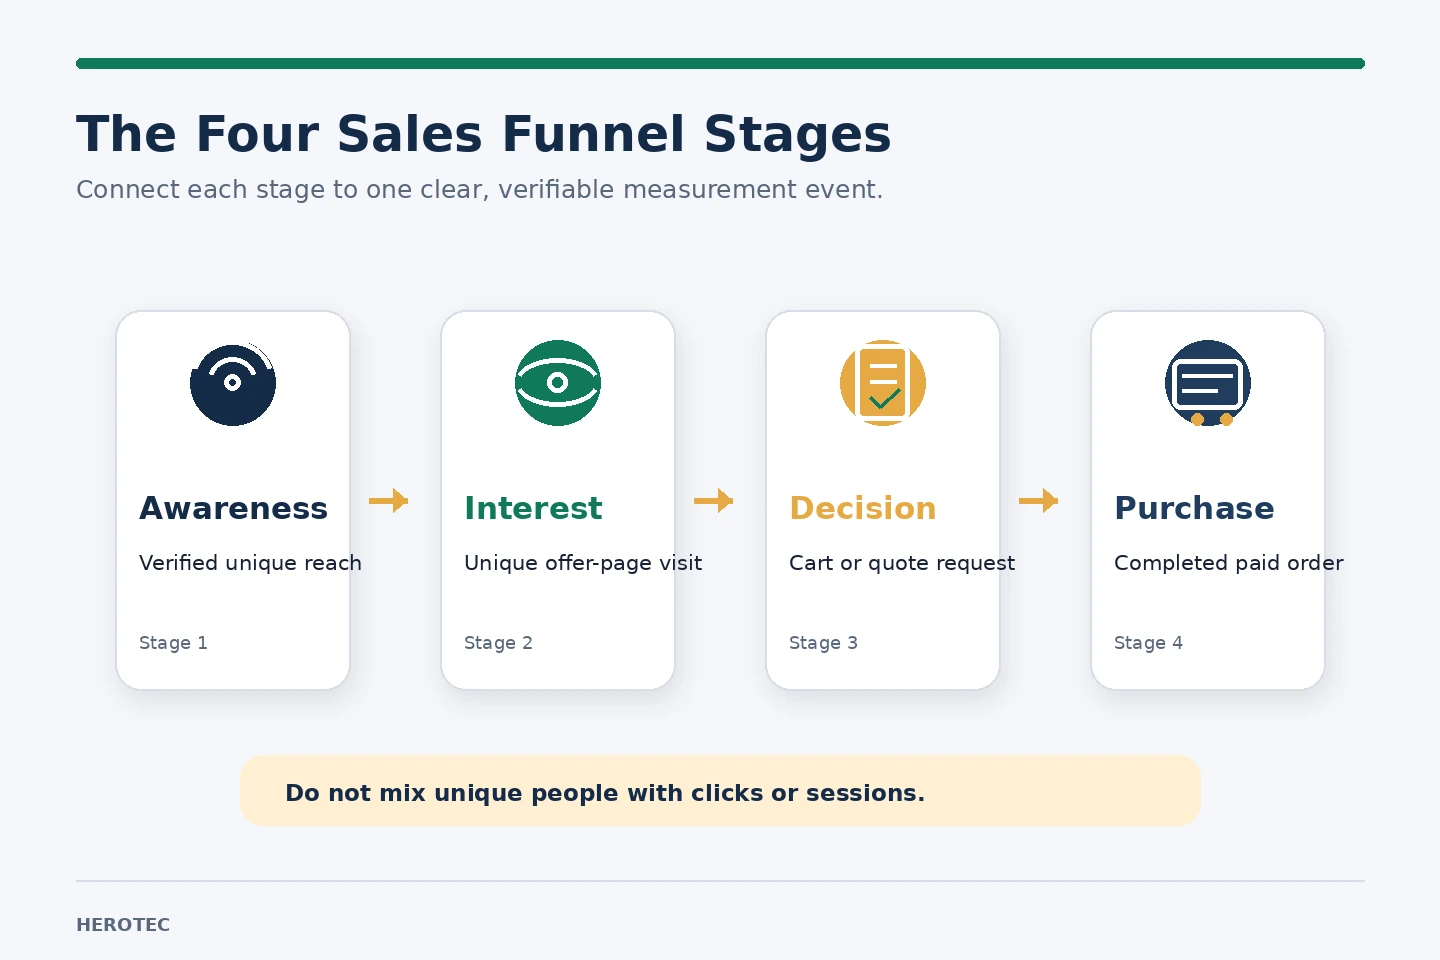
Four practical stages, each tied to an observable event
The model below is a starting point. Adapt it to your business, but do not change a stage definition halfway through a comparison.
| Stage | Practical meaning | Example qualifying event |
|---|---|---|
| Awareness | Unique people reached by relevant content or an offer | A valid unique reach measure from the selected source |
| Interest | Unique people who show meaningful interest | A unique visit to the relevant product or service page |
| Decision | Unique people taking a step closer to buying | Add to cart, request a quote, or begin an order |
| Purchase | Unique people who complete the intended transaction | A completed and paid purchase |
These examples are not a universal template. A service firm might use a qualified quote request at the decision stage; a store might use add-to-cart. Choose events your analytics, commerce or CRM system can verify.
A click is not a person, and a page view is not necessarily a unique visitor. Do not divide a unique-person count by a session or event total. This analyzer accepts whole-number counts of unique people only.
The core calculations
For each transition between consecutive stages, calculate stage conversion:
Unique people at the next stage ÷ Unique people at the previous stage × 100Then calculate leakage:
100 − Stage conversion (%)The absolute number of people who did not progress is:
Previous-stage people − Next-stage peopleOverall journey conversion is the number of people at the final stage divided by the number at the first stage, multiplied by 100. It summarises the beginning-to-end result; it does not replace the transition-by-transition analysis.
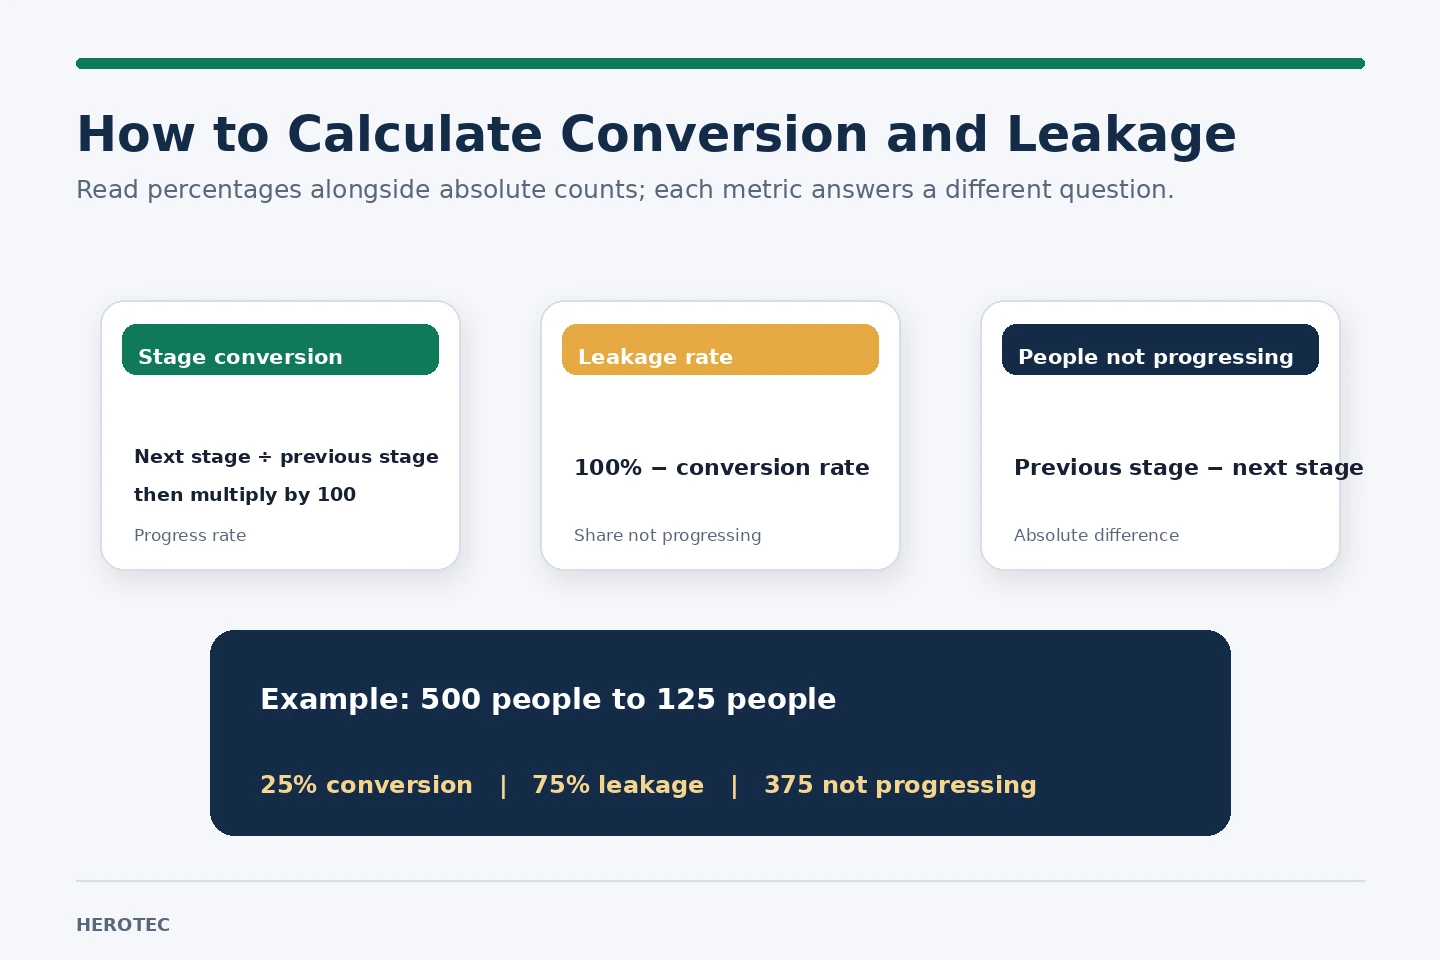
A simple calculation: 500 people reach an interest stage and 125 progress to decision. Stage conversion is 25%, leakage is 75%, and 375 people did not record the next event. This does not mean that 375 people created a financial loss. It means they did not meet the next-stage definition within the measurement window you selected.
Make the data comparable before interpreting it
Figures do not become comparable simply because they appear in the same dashboard. Record a short measurement specification before extracting the counts:
- Time window: Record exact start and end dates, and use a consistent time zone when extracting reports. Do not compare a complete week with a partial week without accounting for the difference.
- Event definition: Specify what qualifies a person for each stage. Is interest a visit to one product page or any visit to the website?
- Counting unit and cohort: Use unique people throughout and confirm that the stages represent the same measurable journey. Do not mix people with clicks or sessions.
- Channel and source: Record the channel, analytics or CRM source, and attribution rule.
- Scope: Keep geography, product range and customer segment consistent.
In a sequential closed funnel, a later-stage count should not exceed the preceding-stage count. If it does, stop and review event definitions, dates, attribution and extraction logic. Do not force a calculation or display negative leakage. When the previous-stage denominator is zero, the rate is unavailable—not 0% or infinity.
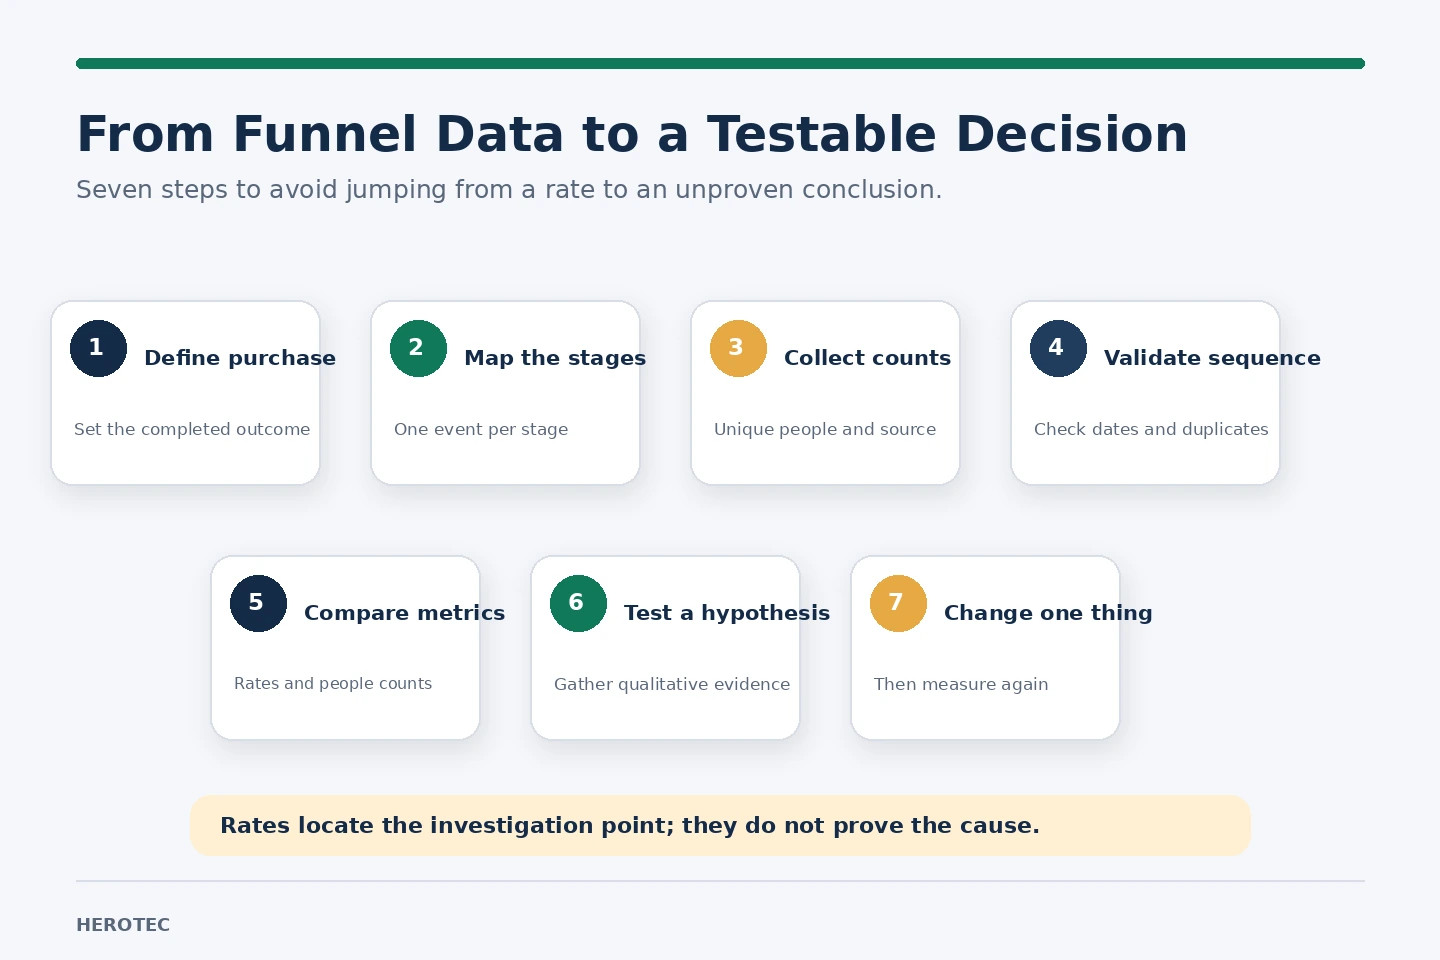
A seven-step method for funnel analysis
1. Start with the commercial outcome
Define what counts as a completed purchase in your business: a settled payment, a confirmed order, or a signed contract. A form submission is not a completed sale unless that is genuinely the transaction you intend to measure. A clear end point helps you select meaningful preceding events.
2. Map the sequence your systems can prove
List the stages in order and assign one primary event to each. If “decision” means add-to-cart in one month and request-a-quote in the next, the periods are not comparable. Analyse distinct events separately unless a documented rule justifies combining them.
3. Extract counts from a named source
Collect unique-person counts and record the filters, dates and channels. Note whether the source relies on sessions, user identifiers or customer IDs. Do not assume separate reports share definitions.
4. Validate the sequence
Check that no later-stage count exceeds the previous one. Review blank and negative values, duplication, date mismatches and attribution changes. A percentage can be mathematically correct but analytically wrong when its denominator or event is wrong.
5. Read rates and counts together
The lowest conversion rate identifies one transition for investigation. The largest absolute number not progressing may sit elsewhere because its starting population is larger. Ask both questions separately. Commercial priority may also depend on value or margin, which should be analysed separately rather than mixed into the funnel equations.
6. Form and test a cause hypothesis
The funnel shows where to investigate, not why the drop occurred. Between interest and decision, inspect product information, alignment between the campaign promise and landing page, availability, proof and price clarity. Between decision and purchase, review checkout steps, delivery costs, displayed fees, payment methods, error messages and return terms. For a service business, review response time and clarity of scope.
Use customer feedback, brief surveys, support records and page or session diagnostics where lawful and appropriate. Quantitative data indicates where to look; qualitative evidence helps explain what may be happening. Avoid collecting personal data you do not need.
7. Change one thing and monitor it
Choose a specific intervention, assign an owner, set a due date and define a success measure and review period. “Show the delivery cost before checkout” is more testable than “improve the store experience.” Keep the same definitions and counting method when measuring again. Do not claim causation unless the test design supports it.
A fictional example: Tidekind refillable home-care kits
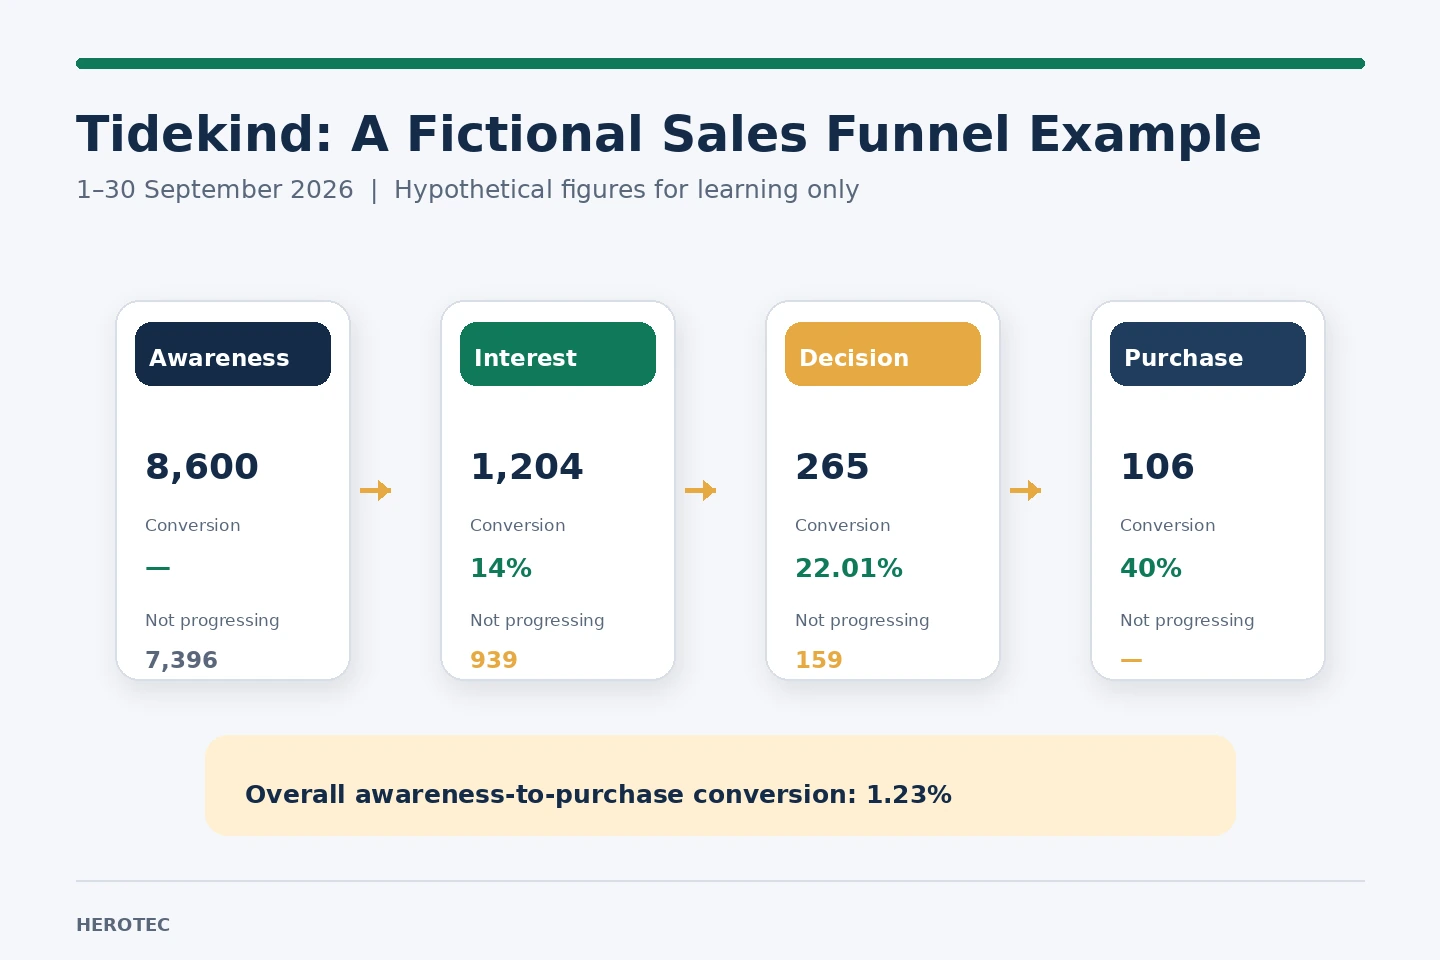
Imagine a fictional online business called Tidekind selling refillable home-cleaning kits. Its team wants to understand the purchase journey for 1–30 September 2026. The following figures are hypothetical and educational only. They are not market data, an industry benchmark or results from a real client.
| Stage | Unique people |
|---|---|
| Awareness | 8,600 |
| Interest | 1,204 |
| Decision | 265 |
| Purchase | 106 |
Awareness-to-interest conversion is 14%. Interest-to-decision conversion is approximately 22.01%. Decision-to-purchase conversion is 40%. Overall conversion from the first to the final stage is approximately 1.23%.
What should the team notice? The lowest stage conversion is the first transition, from awareness to interest. It also has the largest absolute number of people who did not progress: 7,396. The second transition has 939 people not progressing, and the third has 159. In this example, both measures point to the first transition as a useful place to begin the investigation. They do not prove that the advertising creative is at fault.
Possible explanations include broad reach to people with little need for the product, an unclear campaign message, or a landing page that does not answer questions about refills, compatibility or delivery. The team could segment the first transition by source or device, inspect qualified visits, and test one hypothesis. If decision-to-purchase were weakest in another period, the investigation would shift to cart, checkout, delivery, payment and returns. Similar percentages do not make two businesses directly comparable.
Use the Sales Funnel Analyzer
Enter the date window, channel and source. Define each qualifying event, add unique-person counts, and confirm that the figures describe the same measurable journey. You can edit stage names and add up to eight stages. An increase in a later-stage count blocks calculation until the data is reviewed.
How to interpret the output
- Overall journey conversion: the final-stage count divided by the first-stage count within the dataset you entered.
- Lowest-converting transition: the valid transition with the smallest conversion rate. Treat it as the first place to investigate, not as a root-cause diagnosis.
- People not progressing: the count difference between two consecutive stages. This can be large even when the leakage percentage is lower.
- Review notes: indicate missing context such as time period, channel or data source, which may limit interpretation or comparison.
- Comparison: runs only when stage names and events, source, counting method and relevant date windows are aligned. A channel comparison requires the same dates. A period comparison requires equal-length, non-overlapping windows while channel and source remain unchanged.
Saving is optional and takes place in local browser storage on the same device. Printing uses the browser’s print function. The analyzer does not send the figures to Herotec. Do not enter customer names, phone numbers, addresses or other identifying data; the tool needs aggregate counts only.
Common mistakes that weaken funnel analysis
Mixing clicks and people. One person can generate several clicks or page views. Use one consistent person-counting method.
Changing the stage definition. Do not define interest as a product-page visit in one period and an add-to-cart event in the next, then compare the rates as if nothing changed.
Comparing unequal periods. Two weeks and four weeks may reflect different activity volumes. Use equivalent windows and meaningful rates.
Combining channels with different attribution. Segment channels only when their assignment rules and event definitions align.
Treating the weakest stage as the cause. A funnel shows where to investigate, not whether the cause is price, advertising or checkout.
Chasing a universal benchmark. Rates vary by product, sector and market. Establish a baseline for your own business with stable definitions.
A decision checklist
- The intended purchase is defined as a verifiable completed event.
- Every stage has one clear qualifying event.
- All stage counts use unique people.
- The counts represent the same measurable journey or aligned cohort.
- The time window, source and attribution rule are documented.
- Blank, negative and impossible counts have been reviewed.
- Both rates and absolute people counts have been examined.
- One hypothesis, action, owner and review date are recorded.
- The same definitions are used after the change.
Frequently asked questions
Does a fall in sales mean the advertising campaign failed?
No. Sales are the final outcome of several transitions. Measure the stages, locate the decline and then inspect the message, product page, price, availability, payment and follow-up as relevant. A campaign may be effective at attracting people while a problem exists later in the journey.
What is the difference between a marketing funnel and a sales funnel?
Marketing usually focuses on reach and early interest; sales usually focuses on progression towards a completed sale. Boundaries vary, so state your definition and keep it stable.
Can I compare conversion rates between two channels?
Yes, when dates, stage and event definitions, counting method, source and attribution rules are aligned. Otherwise, mark the comparison unavailable or rebuild the data before drawing a conclusion.
Does a high leakage rate mean a stage must be redesigned?
Not by itself. Collect customer feedback, inspect the relevant page or purchase path, and test a hypothesis. The cause may sit outside the interface, such as audience fit or product availability.
Conclusion: investigate the drop-off; do not guess the cause
A sales funnel is not a decorative graphic or a verdict on marketing quality. It is a structured way to measure progression between defined events, see where people stop moving forward, and decide what to investigate next. Start with precise definitions, use comparable counts, distinguish rates from absolute numbers, and test one hypothesis at a time.
Disciplined growth does not automatically begin by increasing or cutting spend. It begins with a decision supported by evidence that can be measured again.
Build a more disciplined growth decision
Use the Sales Funnel Analysis Worksheet to document your stages, figures, hypothesis and next action. Then explore Safe Growth Engineering, a practical framework connecting marketing, sales and risk management in one operating approach.
Download the companion worksheets: Use Word to document and print your analysis; use Excel to enter stage counts and calculate conversion and leakage.
Build a growth system that can withstand risk
Go beyond the funnel metrics with Safe Growth Engineering: A Practical System to Grow with Confidence and Withstand Risk by Mohamed Fathy. Explore the complete practical framework connecting marketing, sales and risk management.
Get the book on AmazonSources and references
- Mohamed Fathy, Safe Growth Engineering (هندسة النمو الآمن), first edition, 2026: Chapters 3 (starts p. 20) and 8 (starts p. 63). Used for concepts and method only; the example above is new and hypothetical.
- Google Analytics Help, About funnel exploration: explains open and closed funnel exploration and step order.
- Shopify, Conversion funnel analysis: describes measuring drop-off by stage and combining quantitative analysis with qualitative research.
- Zoho PageSense, Funnel analysis: a practical reference for reading stage-to-stage progression and locating drop-offs.
- HubSpot, Sales funnel: further reading on diagnosing progression through a sales process.