
A shopper may compare a product and leave before ordering. The cause may be uncertainty about product fit, a late delivery charge, a confusing cart, an unavailable payment method, or a burdensome form. Ecommerce Conversion Rate Optimization starts by locating and validating friction—not redesigning every page at once.
- Inspect the product page, cart, checkout, and order confirmation as distinct decision points.
- Define a conversion rate with an explicit event, eligible denominator, period, source, and counting unit.
- Separate an observed problem from an assumption that still needs verification.
- Translate one supported friction point into a controlled A/B experiment.
Conversion is an outcome of the whole buying experience
A low order count is a symptom, not a diagnosis. Visitors may reach a product page and fail to understand the offer. They may add an item to the cart, then discover an unexpected delivery charge. They may begin checkout but encounter a form that asks for unnecessary information. They may be ready to buy but cannot use a preferred payment method. Each case calls for a different investigation.
This distinction matters because acquisition, purchase intent, product information, checkout usability, payment acceptance, and fulfilment are related but not interchangeable. A traffic campaign can be effective at generating relevant visits while a product page loses the opportunity. A product page can answer every question while checkout introduces a new obstacle. This article focuses on the decision and completion points inside ecommerce—not on rebuilding a generic marketing funnel or repeating a broad sales-funnel framework.
Cart abandonment is not always a defect: shoppers may browse, compare, or postpone purchase. Baymard reports a 70.19% average in its dataset; this is context, not a target or Egypt-specific benchmark.
Define the conversion event before calculating the rate
“Conversion” can mean several different things in an ecommerce journey. A product-page conversion might be an add-to-cart event. A checkout conversion might be a completed order. A campaign report might use a landing-page action. All are possible measures, but they answer different questions. Before comparing results, name the event and identify the eligible population that belongs in its denominator.
The Herotec Functional Specifications define the primary measure as:
Conversion Rate (%) = Conversions ÷ Eligible Visitors/Contacts × 100
For a product page, the denominator might be unique users who viewed that page during a defined period; another report may count sessions. Either can be useful, but do not compare orders divided by clicks with orders divided by unique visitors, or treat sessions, people, orders, and customers as interchangeable.
- Period: start date and end date.
- Source: one named report, channel, or measurement system.
- Stage: product page, cart, checkout, or order confirmation.
- Event: the precise action that qualifies as a conversion.
- Counting unit: unique users or sessions.
- Denominator: the eligible units for that event and stage.
If the denominator, event, time window, or counting unit is missing, do not manufacture a rate. If conversions exceed eligible units, stop and reconcile the event logic, repeated events, identity rules, and reporting window. A valid calculation is only as reliable as its measurement contract.
Use the book’s 2%–5% reference with context
Chapter 8 of Safe Growth Engineering gives a simplified 2%–5% range as a reference for a good ecommerce product page. It is a contextual reference for a product page, not a universal standard for every store, industry, channel, device, or product. It does not mean that every page below 2% is broken, nor does it guarantee that any store can reach 5%.
Conversion varies with category, price, product complexity, traffic intent, season, device, and sample size. A replenishment item and a specialist skin treatment require different decisions. Build a baseline from comparable store data before interpreting the book’s reference.
Inspect the four buying checkpoints
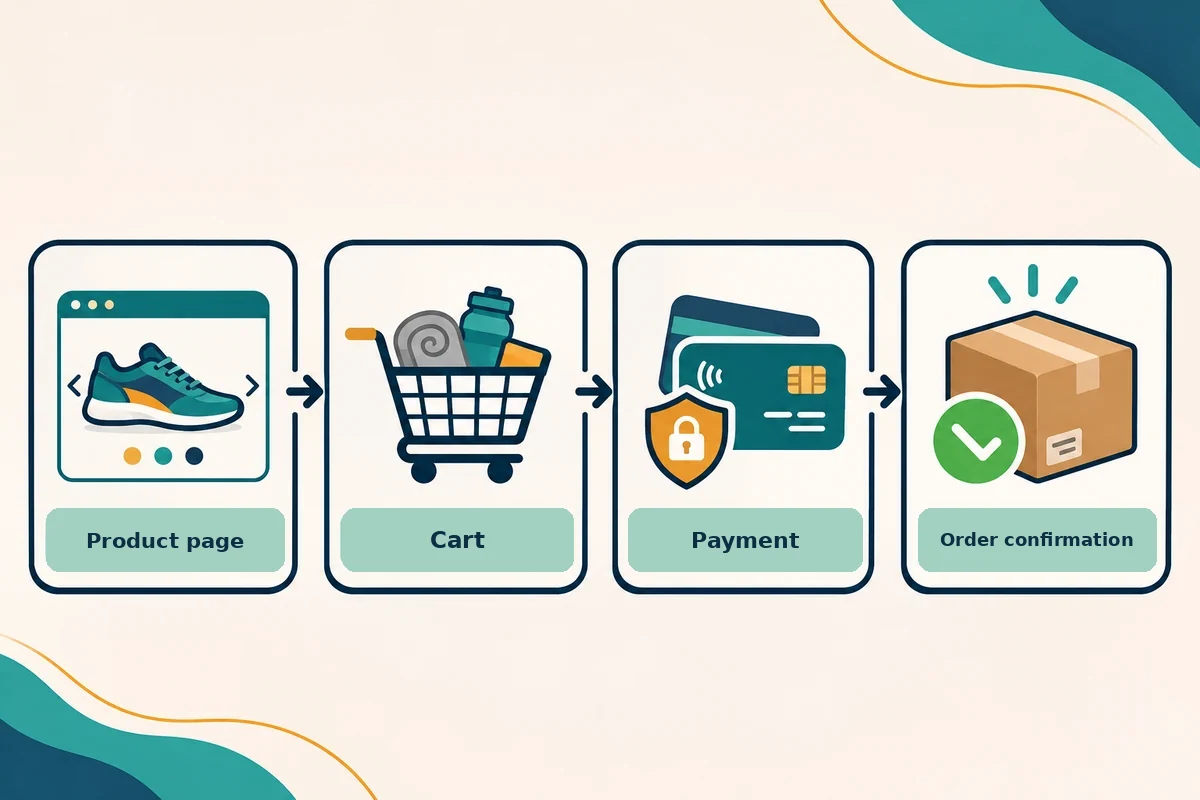
1. Product page: can the shopper make an informed decision?
A product page should explain what the item is, who it serves, and what to expect. Show useful angles, texture, packaging, scale, and the exact variant. Include suitability details—such as size, ingredients, compatibility, or included accessories—when they affect the purchase decision.
Use the title and description to answer practical questions: what the product does, how to use it, its limits, and who it suits. Make availability clear before the shopper adds an unavailable option to the cart.
Show delivery cost or a qualified estimate near the purchase decision, with clear conditions. Make returns, exchanges, warranty, and exclusions easy to find. Baymard research highlights clear images, product options, shipping estimates, and accessible return information; its findings are not automatic predictions for another market.
2. Cart: does the order still make sense?
The cart should let shoppers change quantity or variants, remove items, and continue shopping without losing the order. Show the selected options, price, quantity, subtotal, and known charges. Explain when unknown delivery costs or taxes will be calculated.
3. Checkout: can the customer complete the decision?
Collect only information needed to fulfil and support the order. Offer guest checkout when an account is not essential, mark required fields, and explain unusual requests. An account invitation can be optional after the purchase.
Test checkout on a phone: labels should remain clear, the right keyboard should appear, and errors should identify the affected field and explain how to fix it. Retain valid entries after an error and allow the shopper to review items, address, delivery, payment, and total before submitting.
Do not assume one payment method improves every store. Check what the target audience uses, disclose restrictions or fees, and show available methods before order submission. Give an expected delivery date or range where possible.
4. Order confirmation: is completion clear and measurable?
Confirm that the order was placed, show its reference and summary, and explain how delivery updates will arrive. For measurement, avoid counting a page reload as a new unique buyer; reconcile the purchase event with the order system.
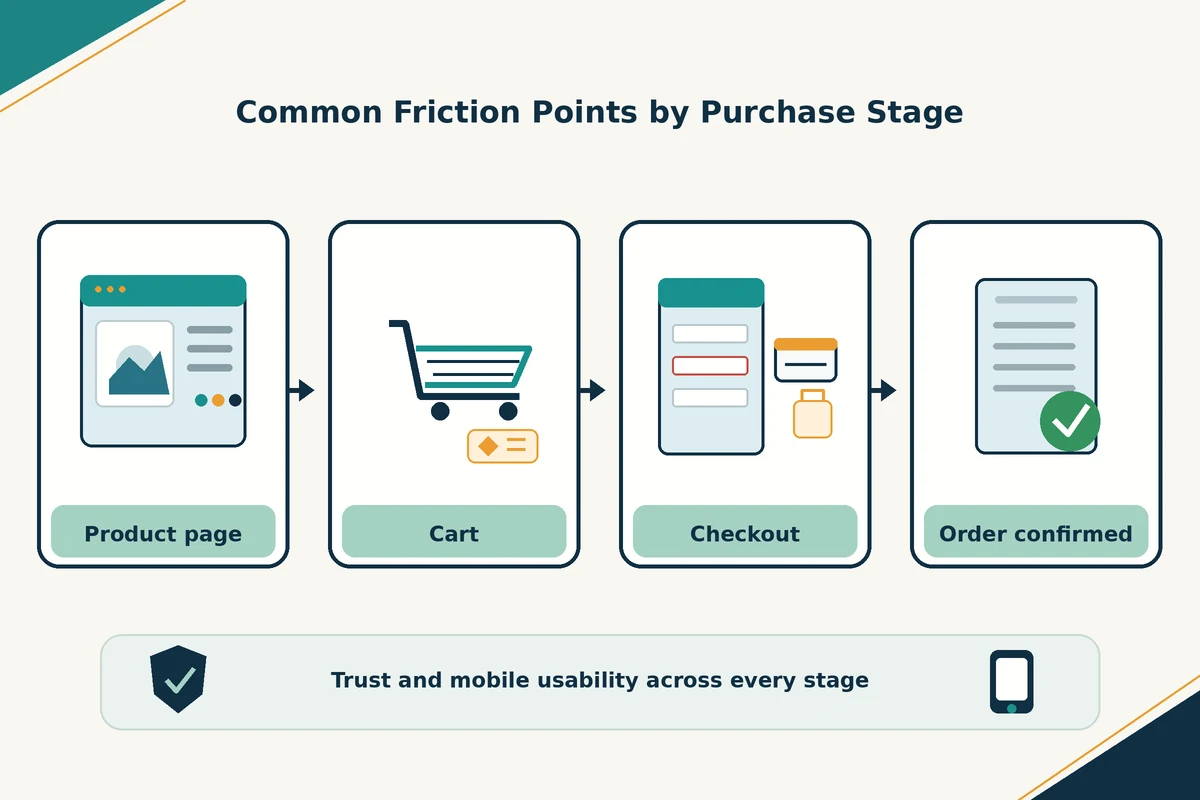
A practical diagnosis: move from observation to a testable explanation
Choose a product group, one traffic source, a comparable date range, and one counting unit. Walk through the journey and record each observation with evidence, review date, and status. Treat unverified explanations as hypotheses, not findings.
When you compare adjacent stages, only use counts that refer to the same cohort, period, source, unit, and stable event definitions. The Functional Specifications define the transition measures as:
Stage Conversion (%) = Next-stage Count ÷ Previous-stage Count × 100
Stage Leakage (%) = 100 − Stage Conversion (%)
If a later-stage count exceeds the prior count, withhold the calculation. Check for mixed units, different periods, repeated events, or changed event definitions; never auto-correct inconsistent counts.
Illustrative example: a specialist skincare store
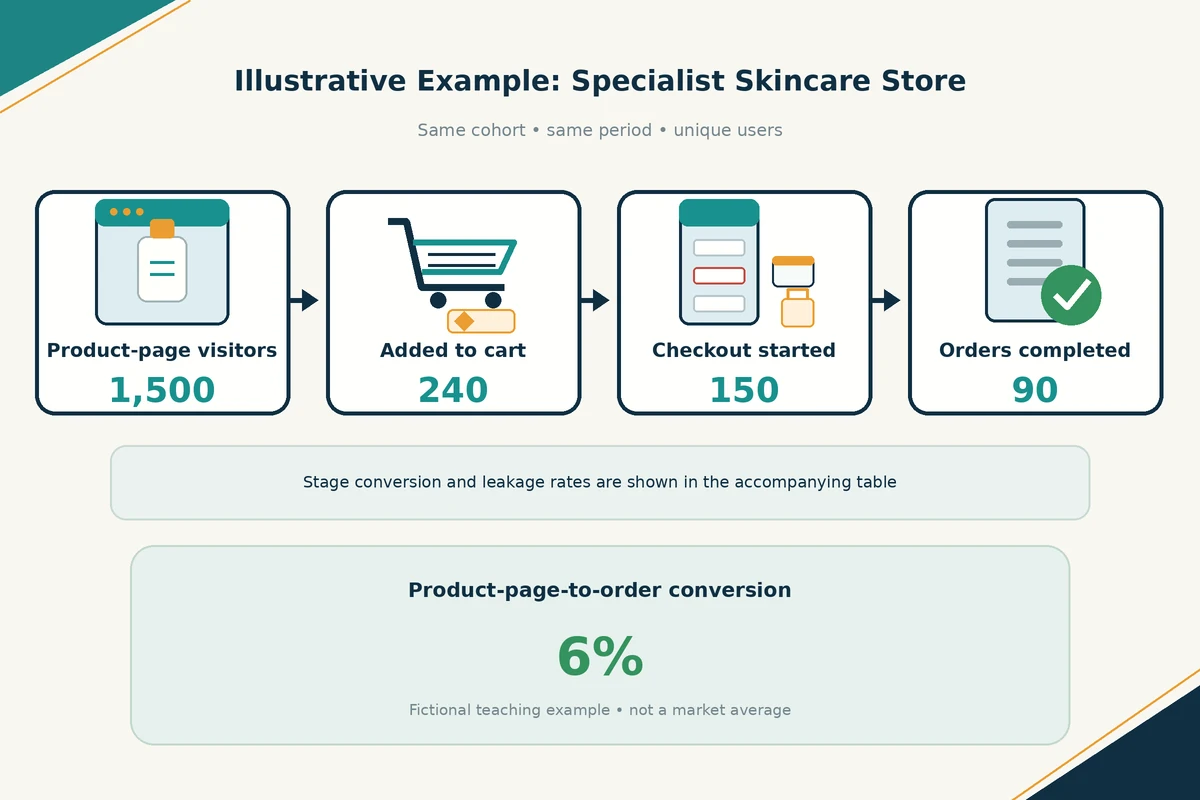
This fictional example illustrates the method, not a market benchmark. A specialist skincare store serving an English-speaking market records 1,500 unique product-page visitors, 240 add-to-cart users, 150 checkout starters, and 90 completed orders during one consistent period and source.
| Checkpoint | Unique users | Conversion from previous stage | Leakage |
|---|---|---|---|
| Product-page view | 1,500 | — | — |
| Added to cart | 240 | 16.00% | 84.00% |
| Checkout started | 150 | 62.50% | 37.50% |
| Order completed | 90 | 60.00% | 40.00% |
Product-page-to-order conversion is 90 ÷ 1,500 × 100 = 6%.
Suppose ingredient and skin-type suitability details are below the purchase section, while support questions repeatedly ask whether the formula suits sensitive skin. The hypothesis is that moving a concise suitability summary near the purchase decision will increase add-to-cart rate. Change only its placement, keep other elements stable, and measure add-to-cart per eligible user from the same source and period. Set the duration and owner before testing; record the result without assuming a lift.
Use the Ecommerce CRO Audit Tool
The tool does not connect to a store, analytics account, payment provider, or external service. It records a manual audit across product page, cart, checkout, trust/support, and mobile experience. Each item stores a status, evidence, review date, and note.
- Enter the store type, sector, and traffic source being reviewed.
- Review each relevant item and mark it present, missing, requiring verification, or not applicable.
- Record evidence when marking an item present or missing; avoid customer personal information.
- Enter measurement data only after confirming the event, period, eligible denominator, source, and counting unit.
- Use the stage analysis only when the counts describe the same cohort and compatible definitions.
- Turn findings into one-variable A/B experiments with a metric, source, duration, owner, and recorded outcome.
- Print or save a PDF report, or export the audit and experiment tables as CSV when needed.
Interpret the output without overstating what it proves
“Missing” flags a gap; “Needs verification” means evidence is incomplete. The tool does not turn item counts into a CRO score or rank opportunities using generic weights.
A calculated rate reflects the values and definitions entered; it does not verify data quality. Stage results appear only when cohort, period, source, unit, and count sequence are consistent.
Test suggestions are not rankings. Choose based on evidence, customer impact, effort, and operational risk. Change one element per experiment so the result remains interpretable.
Run A/B experiments as controlled learning
An A/B test compares two versions of one element against a result defined in advance. Possible variables include a product title, delivery estimate placement, variant control, or one checkout error message. Log the hypothesis, variable, metric, source, duration, owner, and final outcome.
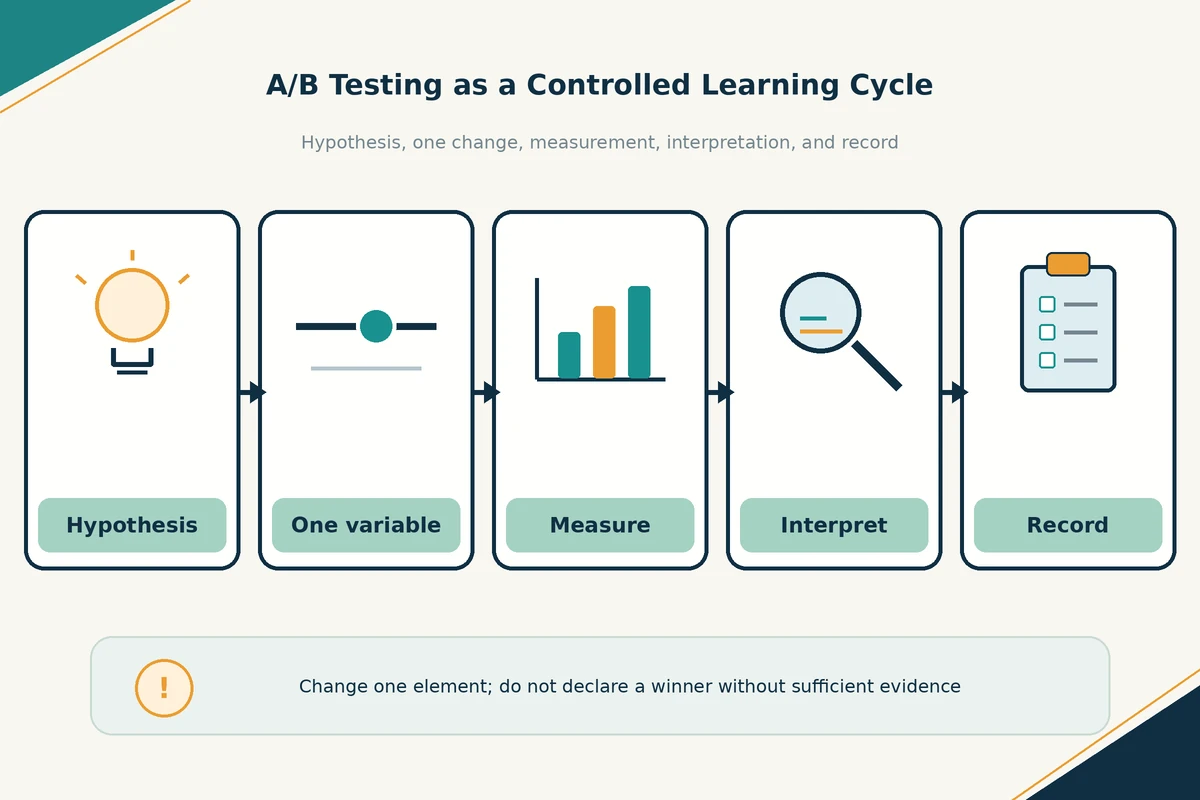
Chapter 9 offers a small-business rule: wait for at least 30 conversions per version or two complete weeks covering the days of the week, whichever takes longer. This is an operational heuristic, not a substitute for sample-size planning or statistical testing; low-volume stores may need more time.
Do not name a winner when the sample is inadequate, the result is unstable, or audience, source, period, or event definitions changed. Record an inconclusive result when evidence is insufficient.
Improve conversion without compromising customer trust
Avoid dark patterns: hidden rejection or cancellation, fake scarcity, undisclosed charges, preselected options against the customer’s interest, and unnecessary forced accounts. Never invent reviews or security badges.
Show the payable amount, delivery terms, returns policy, and payment options before commitment. Collect only necessary data and explain why it is needed. Egypt’s Personal Data Protection Law No. 151 of 2020 is relevant to personal-data processing; obtain legal advice on obligations that apply to the business. This article is not legal advice.
Test the journey on a phone. Google’s good Core Web Vitals thresholds are LCP ≤2.5 seconds, INP <200 milliseconds, and CLS <0.1. They describe loading, responsiveness, and stability—not a conversion formula. WCAG 2.2 supports clearer form labels, error identification, and pointer targets.
A first-review action list
- Define the event, denominator, unit, source, and period.
- Review one product group through cart and checkout.
- Document evidence and identify one testable friction point.
- Test one change and report only what the data supports.
Frequently asked questions
Does every abandoned cart mean checkout is broken?
No. Some shoppers compare, save products, or are not ready to buy. Use stage data, interface review, and customer feedback to identify likely causes rather than assuming one.
Will the tool tell me which change to make first?
No. It organizes evidence and suggests test ideas connected to the recorded findings. It does not issue an overall score, rank opportunities using generic weights, or declare an A/B winner.
Does the tool send store data to a server?
No. Inputs are processed in the browser. Local saving is optional and occurs only when the user selects Save; the draft can be loaded or cleared in the same browser. Do not enter customer names, phone numbers, or other personal data into the notes.
Conclusion: fix the evidenced friction before buying more traffic
Ecommerce Conversion Rate Optimization is not a cosmetic redesign or a revenue promise. It is a disciplined way to understand what shoppers need on the product page, cart, and checkout. Define measurement, collect evidence, address one friction point, and test one change.
Turn the audit into an improvement plan
Use the checklist to record what you observe, then explore the Safe Growth Engineering framework and tools.
References
- Mohamed Fathy, Safe Growth Engineering, Chapter 3 “Understand Your Customer Before You Market to Them”; Chapter 8 “Measure Everything”; Chapter 9 “Improve Your Growth Engine Continuously”, first edition, 2026.
- Herotec Training & Consulting, Functional Specifications – Risk, Growth & Decision Tools, version 1.0, November 2026; Conversion Rate definition, eligible denominator, Stage Conversion, and Stage Leakage rules.
- Baymard Institute: Product Page UX Best Practices 2026, updated 18 March 2026; accessed 21 November 2026.
- Baymard Institute: Checkout UX Best Practices 2026, updated 3 November 2026; accessed 21 November 2026.
- Baymard Institute: Reasons for Cart Abandonment; accessed 21 November 2026.
- Google Search Central: Understanding Core Web Vitals and Google Search; accessed 21 November 2026.
- W3C: Web Content Accessibility Guidelines (WCAG) 2.2; accessed 21 November 2026.
- Egyptian Official Gazette: Personal Data Protection Law No. 151 of 2020; accessed 21 November 2026.